0
$\begingroup$

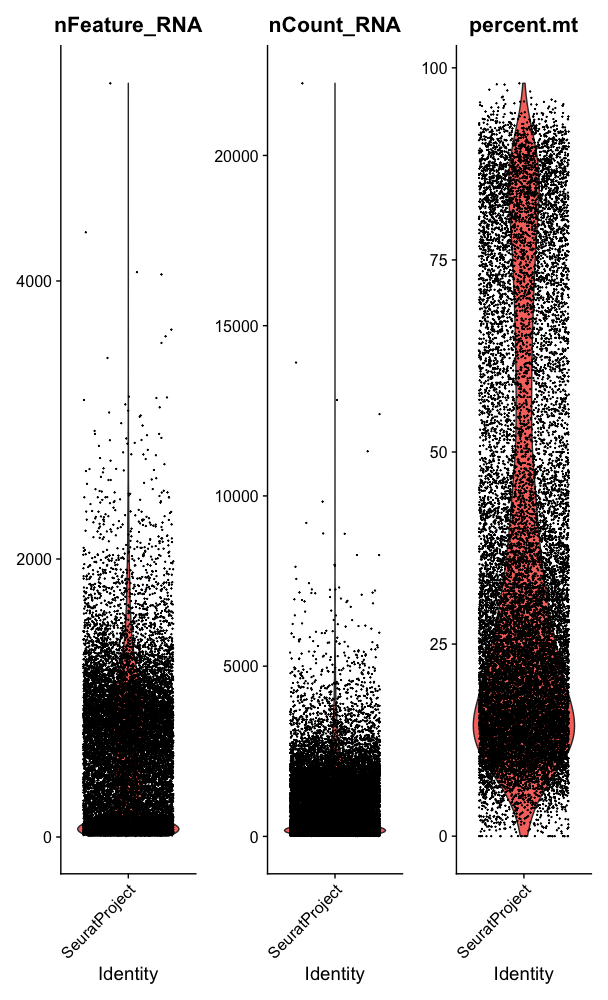
I have a Seurat object which has a high expression of mitochondrial genes

> pbmc1
An object of class Seurat 
36601 features across 18338 samples within 1 assay 
Active assay: RNA (36601 features, 0 variable features)
> 

enter image description here

I want to use SCTransform in Seurat, I don't know if still I should define the mitochondrial percentage or not, if not, how SCTransform function knows which percentage suits for my data?

I used SCTransform without clipping MT genes and I noticed I have the same number of cells

> pbmc_SCTransform <- SCTransform(pbmc, method = "glmGamPoi", vars.to.regress = "percent.mt", verbose = FALSE)
> pbmc_SCTransform
An object of class Seurat 
58629 features across 18338 samples within 2 assays 
Active assay: SCT (22028 features, 3000 variable features)
 1 other assay present: RNA

Is it fine or I should clip MT genes before running SCTransform function?

I am not too sure about the input composition but from 10X websummary two of my samples likely suffer from poor sample prep or poor beginning cell health. The gene expression median genes per cell are 41 and 50 and differential expression show only mitochondrial (MT) and MALAT1 genes. This is indicative of subpar lysis conditions.
$\endgroup$
1
  • $\begingroup$ Frustrating, why down voting? Do you know the answer? You believe in Seurat vignette this has been already mentioned? No $\endgroup$
    – Mahta Mira
    Commented Aug 6, 2021 at 14:42

1 Answer 1

1
$\begingroup$

Mitochondrial gene filtering is done on a case-by-case basis, which is why there's a bit of discussion about choosing appropriate thresholds in the Seurat PBMC3k vignette.

In your specific case, there are a lot of cells with very high mitochondrial gene content. It would be a good idea to work out why that is before doing any more filtering.

However, you're asking specifically about sctransform, and the SCtransform vignette does account for mitochondrial gene content in the transformation:

During normalization, we can also remove confounding sources of variation, for example, mitochondrial mapping percentage

# store mitochondrial percentage in object meta data
pbmc <- PercentageFeatureSet(pbmc, pattern = "^MT-", col.name = "percent.mt")

# run sctransform
pbmc <- SCTransform(pbmc, vars.to.regress = "percent.mt", verbose = FALSE)

There's no filtering in that vignette, but there's also no mention of how clean the data was initially. It's still a good idea to look at your data for outliers, try to understand why they are outliers, and have a think about whether or not to exclude them.

$\endgroup$
0

Your Answer

By clicking “Post Your Answer”, you agree to our terms of service and acknowledge you have read our privacy policy.

Not the answer you're looking for? Browse other questions tagged or ask your own question.