deleted 43 characters in body
Source Link

I recommend using densitree: https://www.cs.auckland.ac.nz/~remco/DensiTree/

And rwty: https://github.com/danlwarren/RWTY

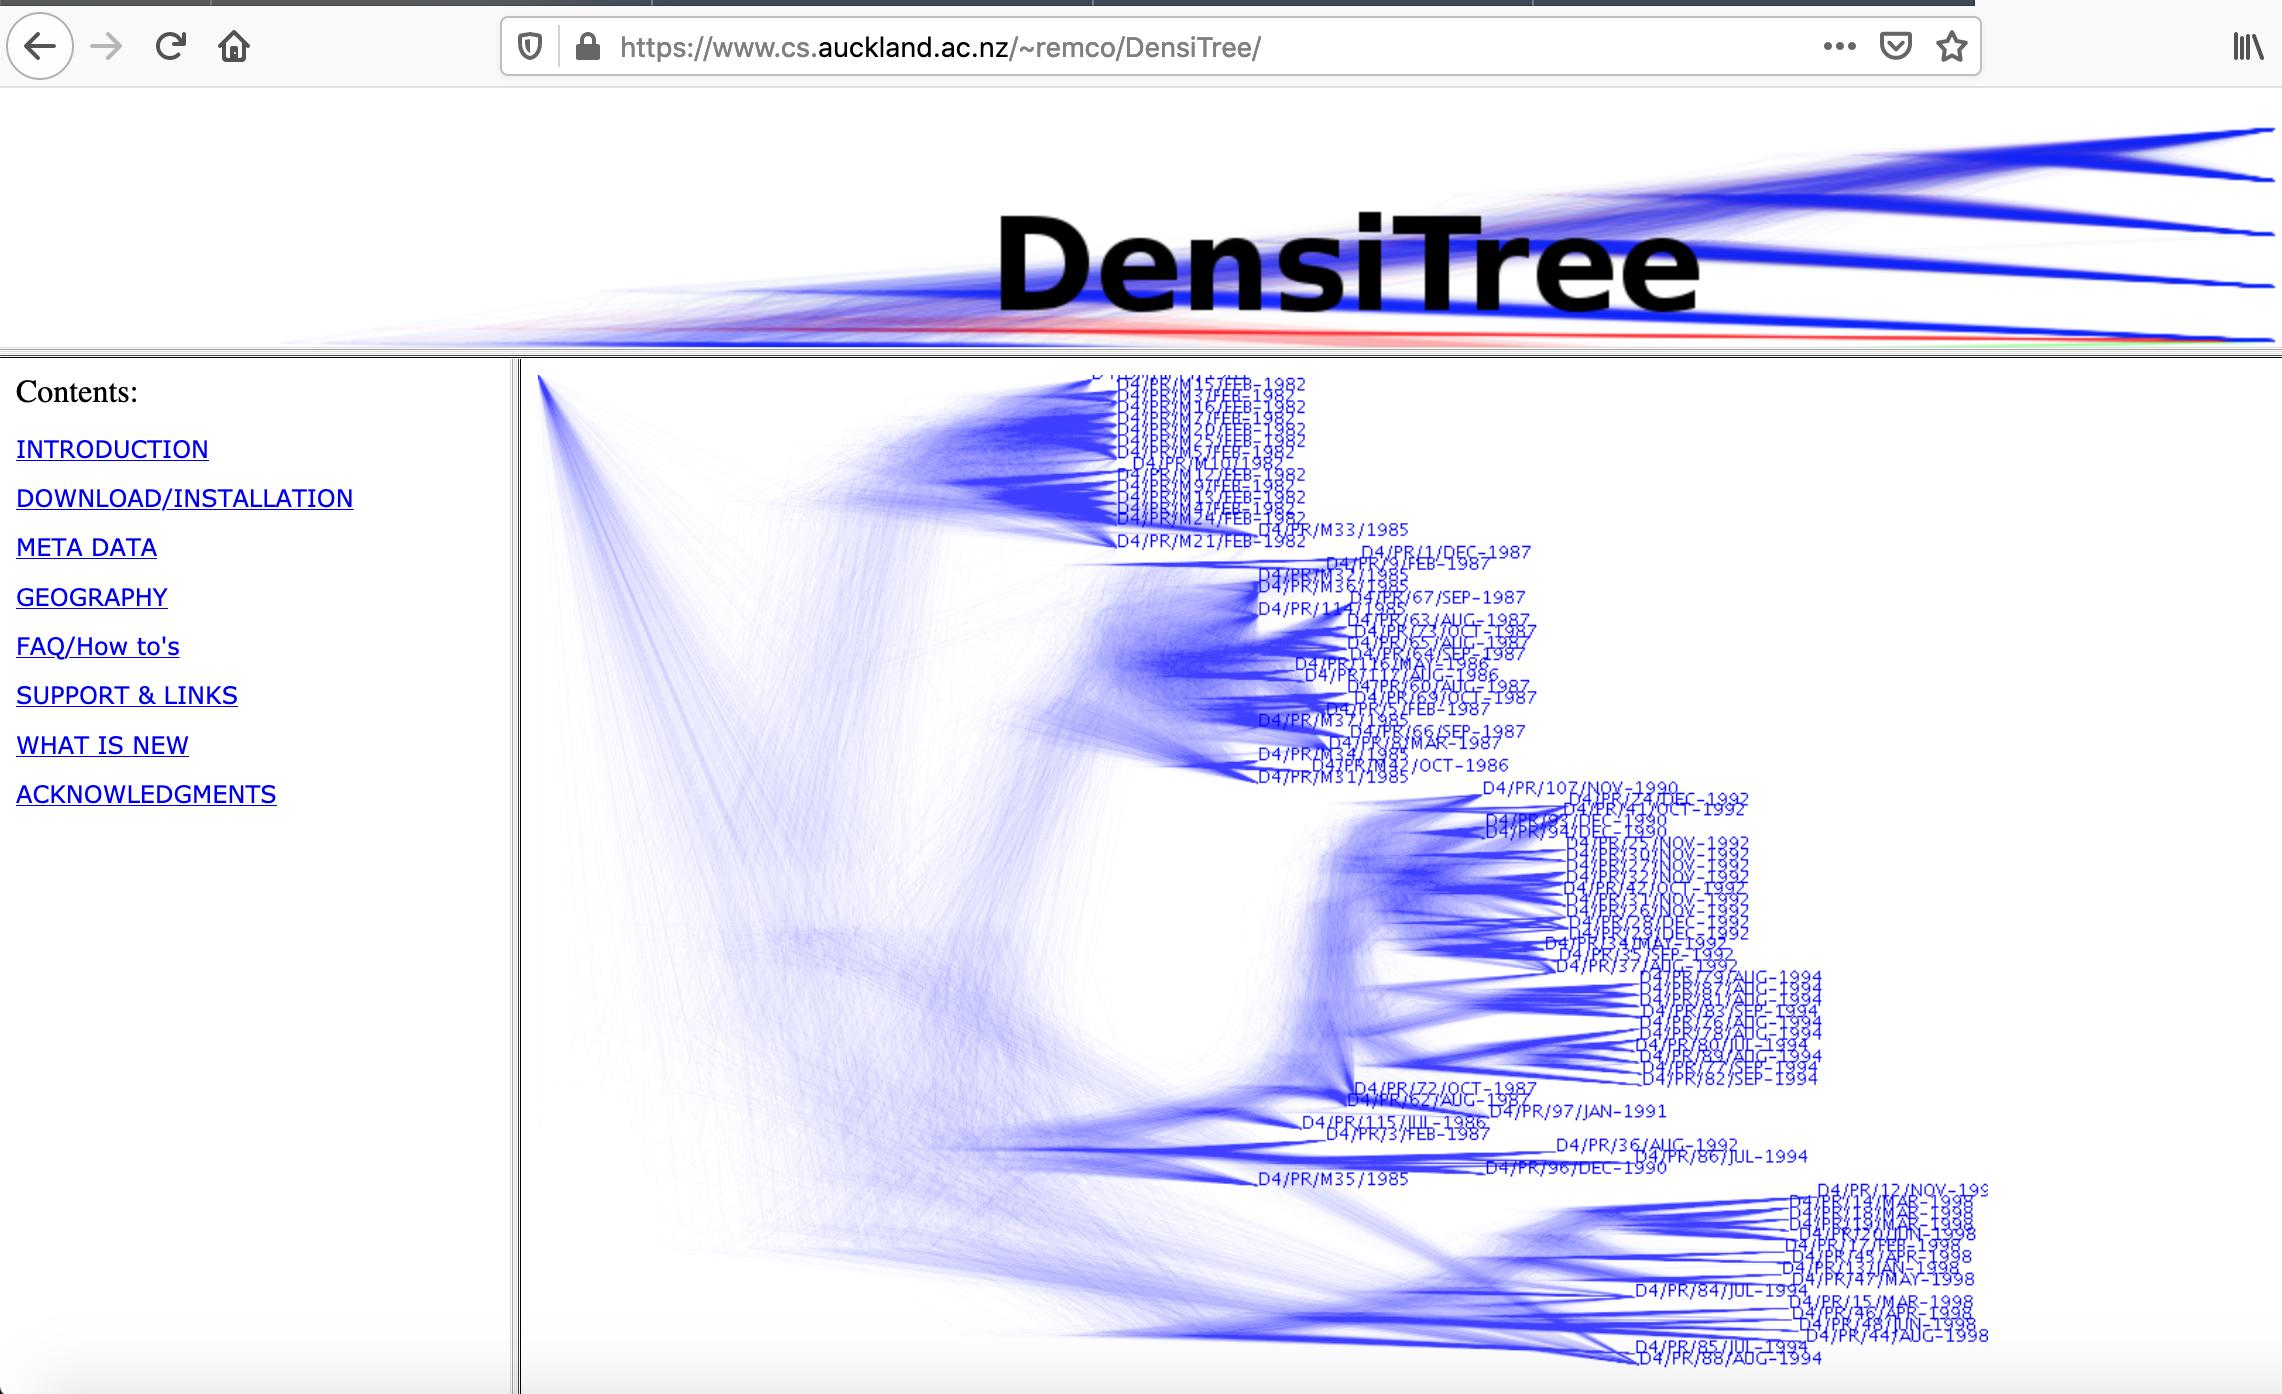
Densitree plots the superimposed set of trees in a heatmap-like format: enter image description heredensitree
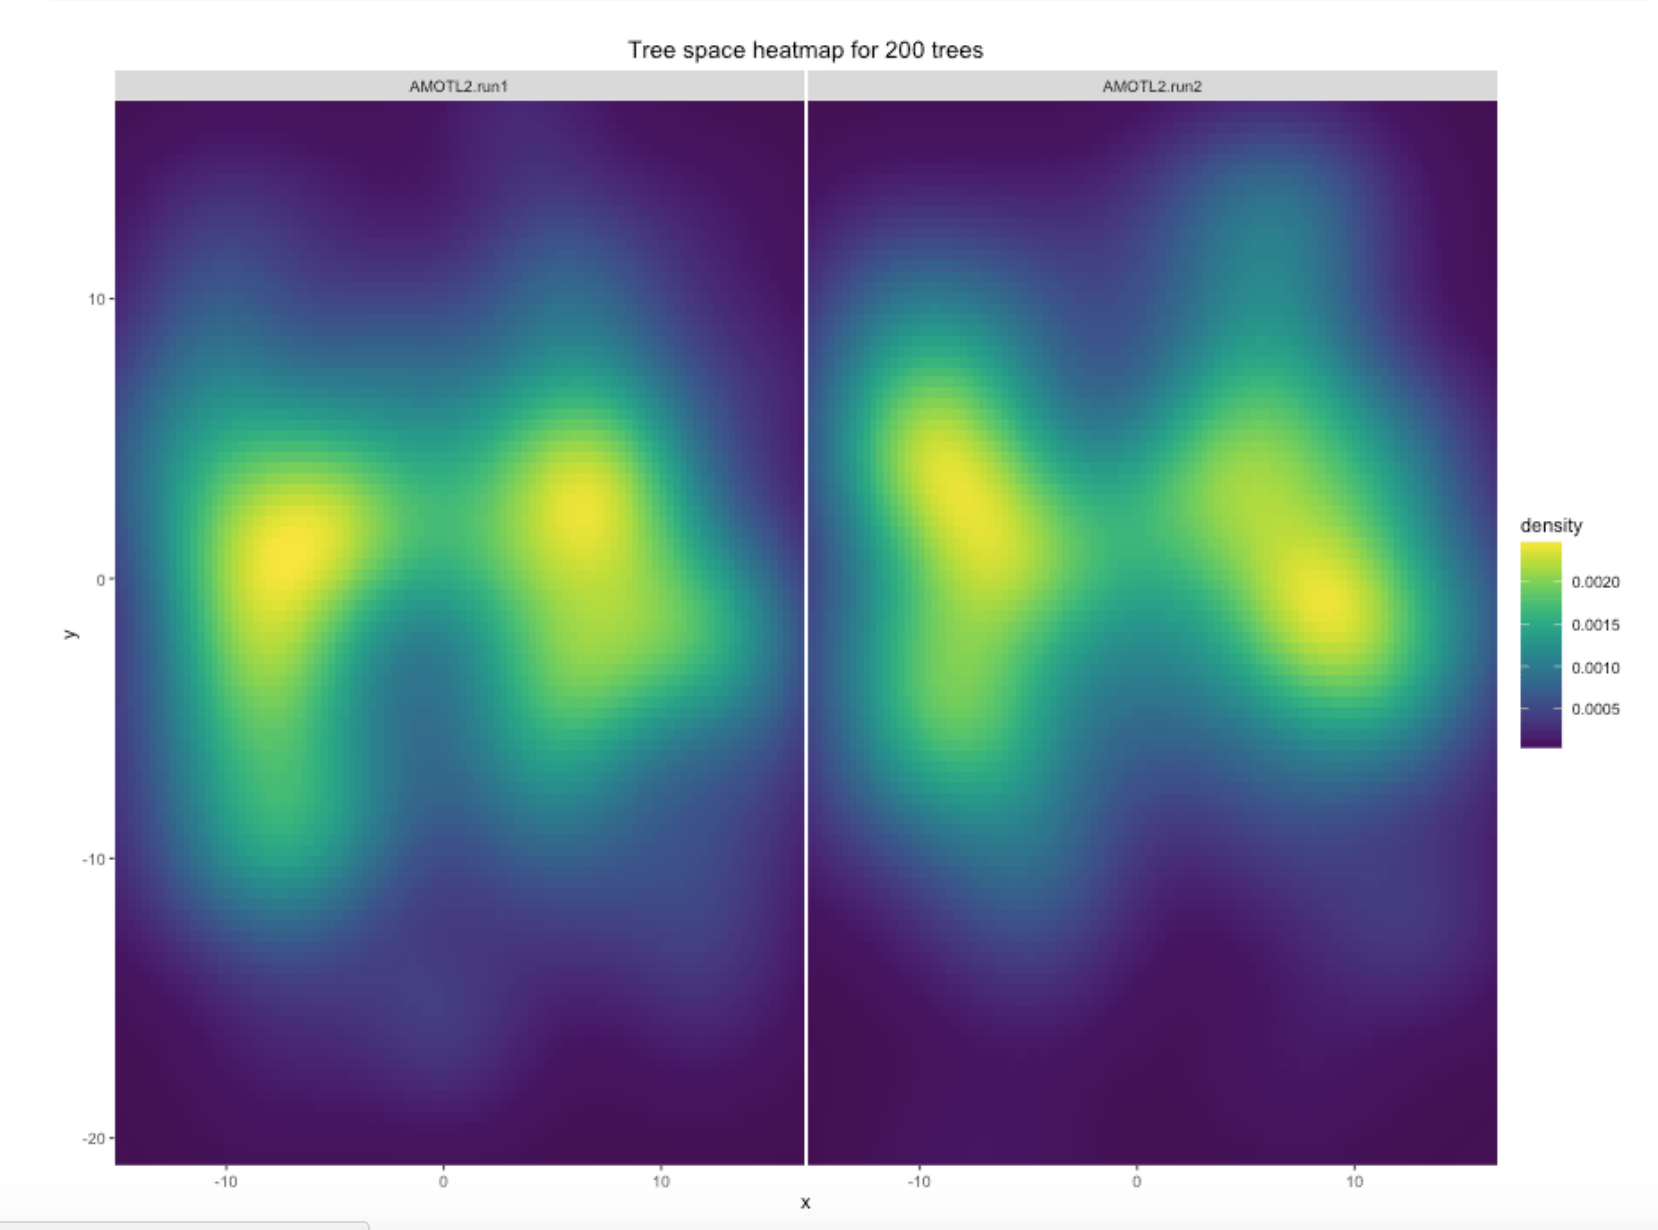
And rwty, a very powerful R package that allows visualisation of treespace in an NMDS format (among other methods): enter image description hererwty

I recommend using densitree: https://www.cs.auckland.ac.nz/~remco/DensiTree/

And rwty: https://github.com/danlwarren/RWTY

Densitree plots the superimposed set of trees in a heatmap-like format: enter image description here

And rwty, a very powerful R package that allows visualisation of treespace in an NMDS format (among other methods): enter image description here
I recommend using densitree: https://www.cs.auckland.ac.nz/~remco/DensiTree/

And rwty: https://github.com/danlwarren/RWTY

Densitree plots the superimposed set of trees in a heatmap-like format: densitree

And rwty, a very powerful R package that allows visualisation of treespace in an NMDS format (among other methods): rwty

added 368 characters in body
Source Link

I recommend using densitree: https://www.cs.auckland.ac.nz/~remco/DensiTree/

And rwty: https://github.com/danlwarren/RWTY

Densitree plots the superimposed set of trees in a heatmap-like format: enter image description here

And rwty, a very powerful R package that allows visualisation of treespace in an NMDS format (among other methods): enter image description here

I recommend using densitree: https://www.cs.auckland.ac.nz/~remco/DensiTree/

And rwty: https://github.com/danlwarren/RWTY

Densitree plots the superimposed set of trees in a heatmap-like format: enter image description here

And rwty, a very powerful R package that allows visualisation of treespace in an NMDS format (among other methods): enter image description here

Source Link