added 1017 characters in body
Source Link
gringer
  • 15.1k
  • 5
  • 24
  • 83

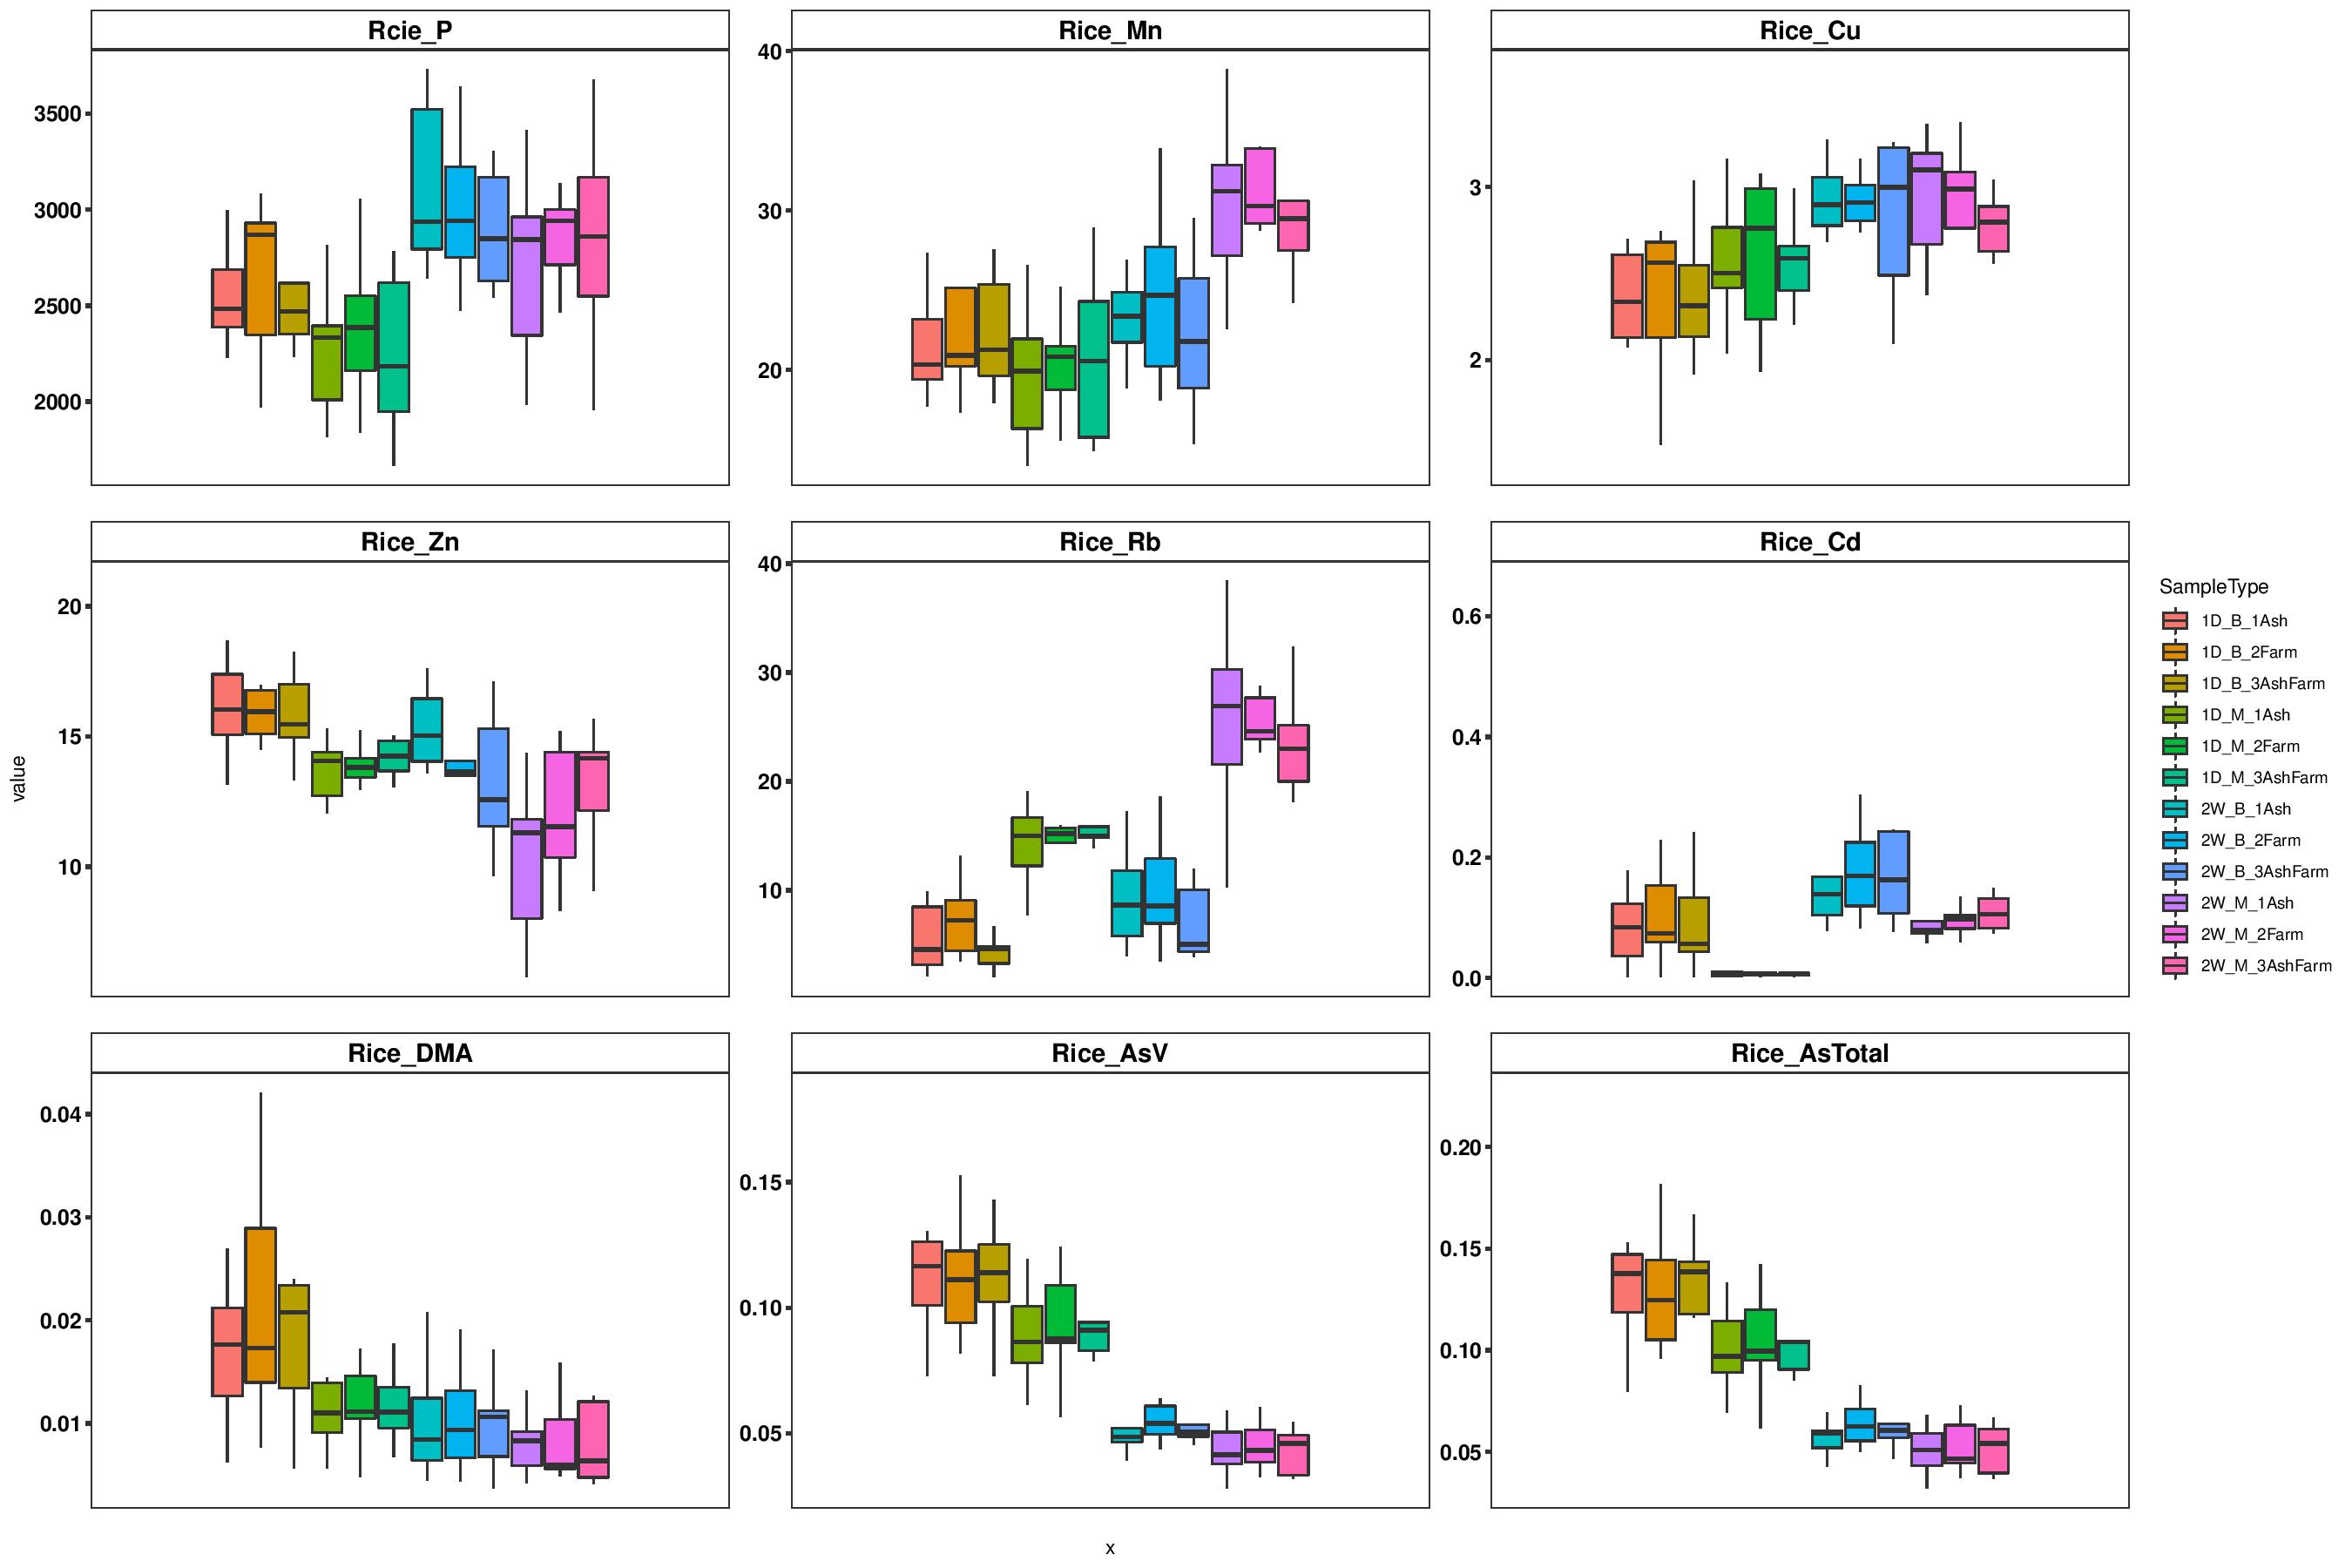
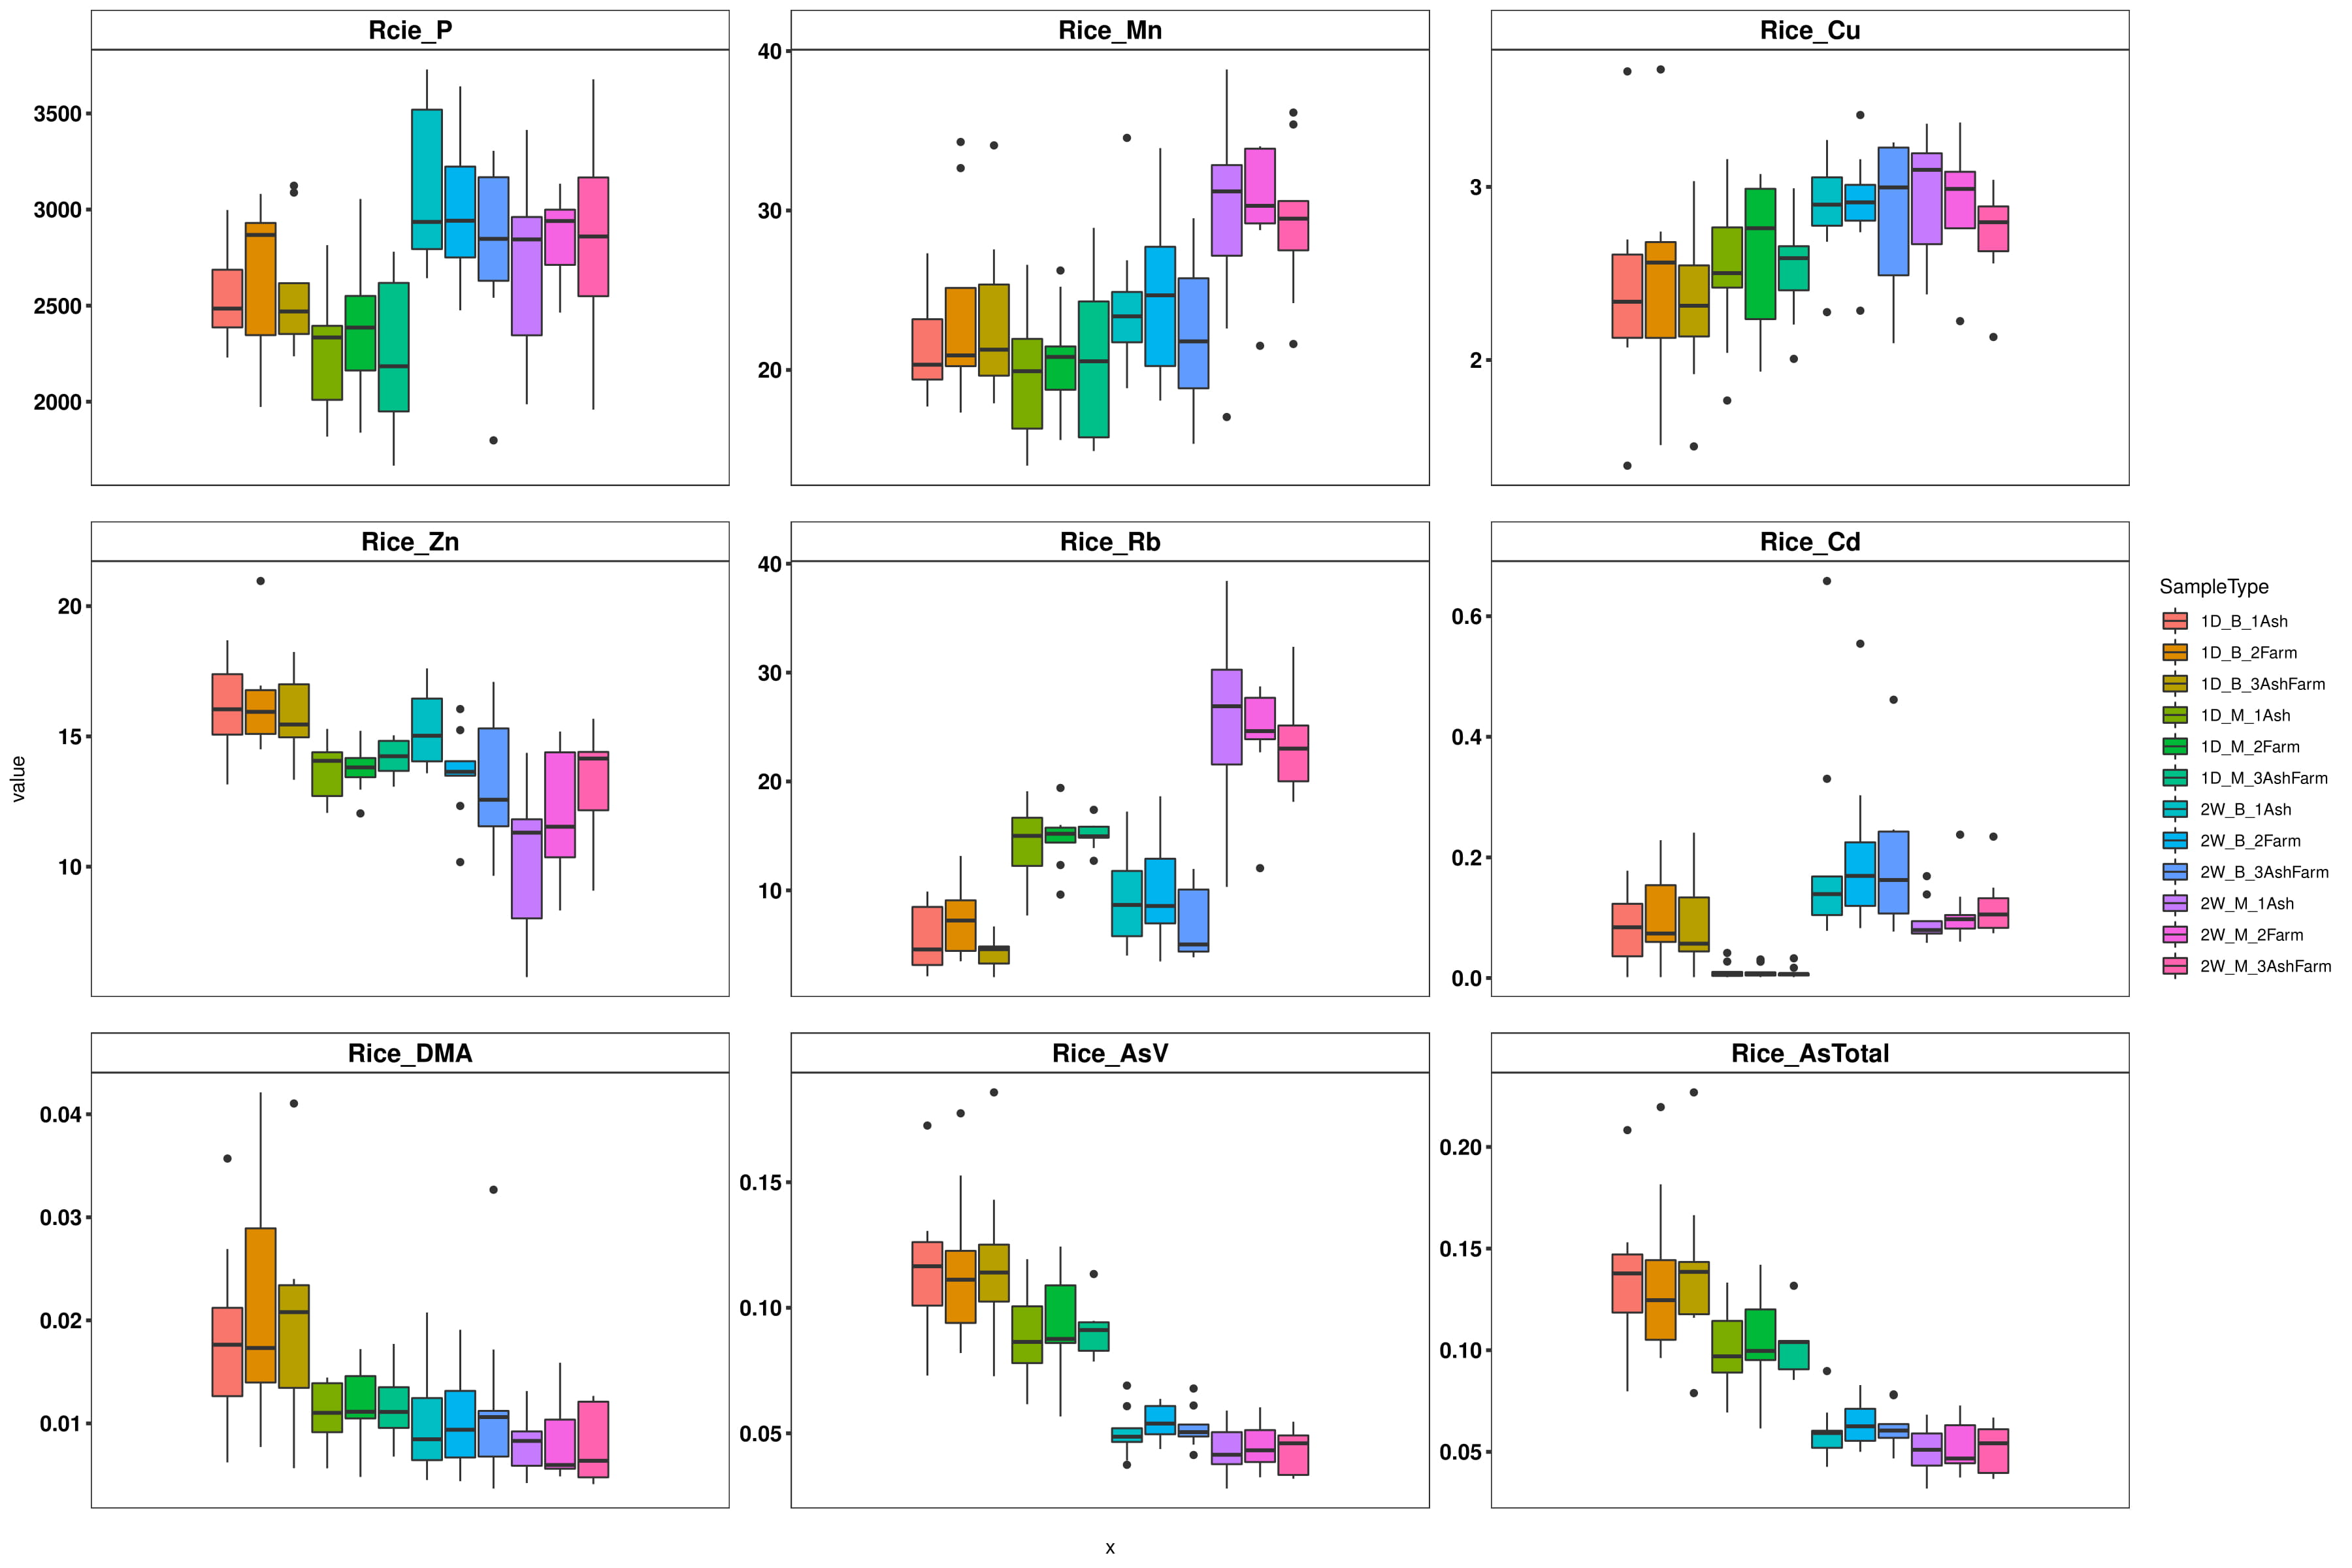
I am using below code to plot multiple box plot but I am still struggling to understand how I can add whisker to box plot and how to change sample order like in this figure SampleType?

library(reshape2)
library(ggplot2)
list.files()
morphData <- read.table("Box.plot.chemical.txt", sep="\t", header=TRUE)
morphData
df.m <- melt(morphData, id.var = "SampleType")


pdf("box.plot.pdf", width = 18, height = 12)


p <- ggplot(data = df.m, aes(x="", y=value)) +

theme_bw() +
theme(
      panel.grid.major=element_blank(),
      panel.grid.minor=element_blank(),
      plot.title = element_text(vjust = -8.5,hjust = 0.1),
      line=element_line(size=1),
     
      axis.text.x = element_text(size = 10, face ="bold", hjust = 0.5, colour = "black"),
      axis.text.y = element_text(size = 12, face ="bold", hjust = 0.5, colour = "black"),
      axis.ticks.x = element_blank()) +
       

theme(strip.background=element_rect(fill="white")) +
theme(strip.text=element_text(color="black",face="bold", size =14)) + 
geom_boxplot(aes(fill=SampleType),outlier.colour = NA) 
p + facet_wrap(.~variable, scales="free") 
dev.off();

update:

I was able to remove the variable name from the bottom by using above updated code but still getting tick mark on x-axis, and also how I can make these label bold?

update:

It will be a great help if you could also guide me how I can add Tukey's posthoc significance letter in above box plot to make this plot more meaningful. I was able to make bold facet wrap text, now please help me with posthoc test letter. I have updated the code again.

update:

Can you please help to change the order of samples; like I want to change the order of SampleType in this box plot and also how we can remove outlier and will it be possible to add whisker so it will look better. I was able to remove outlier by using outlier.colour = NA, Now It just whisker, but I am not able to understand How I can add whisker to box plot? I have updated the code and figure above.

update:

sorry, I wanted to add errorbar and with this command, it is not adding error bar on all box: stat_boxplot(geom ="errorbar")
I am using below code to plot multiple box plot but I am still struggling to understand how I can add whisker to box plot and how to change sample order like in this figure SampleType?

library(reshape2)
library(ggplot2)
list.files()
morphData <- read.table("Box.plot.chemical.txt", sep="\t", header=TRUE)
morphData
df.m <- melt(morphData, id.var = "SampleType")


pdf("box.plot.pdf", width = 18, height = 12)


p <- ggplot(data = df.m, aes(x="", y=value)) +

theme_bw() +
theme(
      panel.grid.major=element_blank(),
      panel.grid.minor=element_blank(),
      plot.title = element_text(vjust = -8.5,hjust = 0.1),
      line=element_line(size=1),
     
      axis.text.x = element_text(size = 10, face ="bold", hjust = 0.5, colour = "black"),
      axis.text.y = element_text(size = 12, face ="bold", hjust = 0.5, colour = "black"),
      axis.ticks.x = element_blank()) +
       

theme(strip.background=element_rect(fill="white")) +
theme(strip.text=element_text(color="black",face="bold", size =14)) + 
geom_boxplot(aes(fill=SampleType),outlier.colour = NA) 
p + facet_wrap(.~variable, scales="free") 
dev.off();

update:

I was able to remove the variable name from the bottom by using above updated code but still getting tick mark on x-axis, and also how I can make these label bold?

update:

It will be a great help if you could also guide me how I can add Tukey's posthoc significance letter in above box plot to make this plot more meaningful. I was able to make bold facet wrap text, now please help me with posthoc test letter. I have updated the code again.

update:

Can you please help to change the order of samples; like I want to change the order of SampleType in this box plot and also how we can remove outlier and will it be possible to add whisker so it will look better. I was able to remove outlier by using outlier.colour = NA, Now It just whisker, but I am not able to understand How I can add whisker to box plot? I have updated the code and figure above.

update:

sorry, I wanted to add errorbar and with this command, it is not adding error bar on all box: stat_boxplot(geom ="errorbar")

deleted 87 characters in body
Source Link
bioinfonext
  • 393
  • 2
  • 14

I am using below code to plot multiple box plot but I am still struggling to understand how I can add whisker to box plot and how to change sample order like in this figure SampleType?

library(reshape2)
library(ggplot2)
list.files()
morphData <- read.table("Box.plot.chemical.txt", sep="\t", header=TRUE)
morphData
df.m <- melt(morphData, id.var = "SampleType")


pdf("box.plot.pdf", width = 18, height = 12)


p <- ggplot(data = df.m, aes(x="", y=value)) +

theme_bw() +
theme(
      panel.grid.major=element_blank(),
      panel.grid.minor=element_blank(),
      plot.title = element_text(vjust = -8.5,hjust = 0.1),
      line=element_line(size=1),
     
      axis.text.x = element_text(size = 10, face ="bold", hjust = 0.5, colour = "black"),
      axis.text.y = element_text(size = 12, face ="bold", hjust = 0.5, colour = "black"),
      axis.ticks.x = element_blank()) +
       

theme(strip.background=element_rect(fill="white")) +
theme(strip.text=element_text(color="black",face="bold", size =14)) + 
geom_boxplot(aes(fill=SampleType),outlier.colour = NA) 
p + facet_wrap(.~variable, scales="free") 
dev.off();

enter image description here

I am using below code to plot multiple box plot but I am still struggling to understand how I can add whisker to box plot and how to change sample order like in this figure SampleType?

library(reshape2)
library(ggplot2)
list.files()
morphData <- read.table("Box.plot.chemical.txt", sep="\t", header=TRUE)
morphData
df.m <- melt(morphData, id.var = "SampleType")


pdf("box.plot.pdf", width = 18, height = 12)


p <- ggplot(data = df.m, aes(x="", y=value)) +

theme_bw() +
theme(
      panel.grid.major=element_blank(),
      panel.grid.minor=element_blank(),
      plot.title = element_text(vjust = -8.5,hjust = 0.1),
      line=element_line(size=1),
     
      axis.text.x = element_text(size = 10, face ="bold", hjust = 0.5, colour = "black"),
      axis.text.y = element_text(size = 12, face ="bold", hjust = 0.5, colour = "black"),
      axis.ticks.x = element_blank()) +
       

theme(strip.background=element_rect(fill="white")) +
theme(strip.text=element_text(color="black",face="bold", size =14)) + 
geom_boxplot(aes(fill=SampleType),outlier.colour = NA) 
p + facet_wrap(.~variable, scales="free") 
dev.off();
deleted 603 characters in body
Source Link
bioinfonext
  • 393
  • 2
  • 14

Multiple box plot and annova

I am using below code to plot multiple box plot but I am still getting tick mark on X-axis and I also wantstruggling to add (mg/kg) with the variable name at the top so it should look like Rice_p (mg/Kg) and furtherunderstand how I can do ANOVAadd whisker to box plot and posthoc testhow to find the significant difference between groups.change sample order like in this figure SampleType?

library(reshape2)
library(ggplot2)
list.files()
morphData <- read.table("Box.plot.chemical.txt", sep="\t", header=TRUE)
morphData


       SampleType   Rcie_P  Rice_Mn  Rice_Cu   Rice_Zn   Rice_Rb     Rice_Cd
1       1D_M_1Ash 2814.689 23.72055 2.766135 14.458523 14.547134 0.041588921
2      1D_M_2Farm 1838.551 18.75750 2.439463 12.956492  9.603595 0.030881586
3   1D_M_3AshFarm 2184.207 20.54325 2.595371 13.068580 12.717532 0.032639435
4       1D_M_1Ash 2761.324 26.59382 2.468078 14.062242 17.952447 0.003499666

df.m <- melt(morphData, id.var = "SampleType") 


pdf("box.plot.pdf", width = 18, height = 12)


 p <- ggplot(data = df.m, aes(x="", y=value)) + 

theme_bw() +
theme(
      panel.grid.major=element_blank(),
      panel.grid.minor=element_blank(),
      plot.title = element_text(vjust = -8.5,hjust = 0.1),
      line=element_line(size=1),
     
      axis.text.x = element_text(size = 10, face ="bold", hjust = 0.5, colour = "black"),
      axis.text.y = element_text(size = 12, face ="bold", hjust = 0.5, colour = "black"),
      axis.ticks.x = element_blank()) +
       

theme(strip.background=element_rect(fill="white")) +
theme(strip.text=element_text(color="black",face="bold", size =14)) + 
geom_boxplot(aes(fill=SampleType),outlier.colour = NA) 
 
p + facet_wrap(.~variable, scales="free") 
dev.off();

enter image description hereenter image description here

Multiple box plot and annova

I am using below code to plot multiple box plot but I am still getting tick mark on X-axis and I also want to add (mg/kg) with the variable name at the top so it should look like Rice_p (mg/Kg) and further how I can do ANOVA and posthoc test to find the significant difference between groups.

library(reshape2)
library(ggplot2)
list.files()
morphData <- read.table("Box.plot.chemical.txt", sep="\t", header=TRUE)
morphData


       SampleType   Rcie_P  Rice_Mn  Rice_Cu   Rice_Zn   Rice_Rb     Rice_Cd
1       1D_M_1Ash 2814.689 23.72055 2.766135 14.458523 14.547134 0.041588921
2      1D_M_2Farm 1838.551 18.75750 2.439463 12.956492  9.603595 0.030881586
3   1D_M_3AshFarm 2184.207 20.54325 2.595371 13.068580 12.717532 0.032639435
4       1D_M_1Ash 2761.324 26.59382 2.468078 14.062242 17.952447 0.003499666

df.m <- melt(morphData, id.var = "SampleType")
pdf("box.plot.pdf", width = 18, height = 12)


 p <- ggplot(data = df.m, aes(x="", y=value)) +
theme_bw() +
theme(
      panel.grid.major=element_blank(),
      panel.grid.minor=element_blank(),
      plot.title = element_text(vjust = -8.5,hjust = 0.1),
      line=element_line(size=1),
     
      axis.text.x = element_text(size = 10, face ="bold", hjust = 0.5, colour = "black"),
      axis.text.y = element_text(size = 12, face ="bold", hjust = 0.5, colour = "black"),
      axis.ticks.x = element_blank()) +
       

theme(strip.background=element_rect(fill="white")) +
theme(strip.text=element_text(color="black",face="bold", size =14)) +
geom_boxplot(aes(fill=SampleType)) 
 
p + facet_wrap(.~variable, scales="free")

enter image description here

Multiple box plot

I am using below code to plot multiple box plot but I am still struggling to understand how I can add whisker to box plot and how to change sample order like in this figure SampleType?

library(reshape2)
library(ggplot2)
list.files()
morphData <- read.table("Box.plot.chemical.txt", sep="\t", header=TRUE)
morphData
df.m <- melt(morphData, id.var = "SampleType") 


pdf("box.plot.pdf", width = 18, height = 12)


p <- ggplot(data = df.m, aes(x="", y=value)) + 

theme_bw() +
theme(
      panel.grid.major=element_blank(),
      panel.grid.minor=element_blank(),
      plot.title = element_text(vjust = -8.5,hjust = 0.1),
      line=element_line(size=1),
     
      axis.text.x = element_text(size = 10, face ="bold", hjust = 0.5, colour = "black"),
      axis.text.y = element_text(size = 12, face ="bold", hjust = 0.5, colour = "black"),
      axis.ticks.x = element_blank()) +
       

theme(strip.background=element_rect(fill="white")) +
theme(strip.text=element_text(color="black",face="bold", size =14)) + 
geom_boxplot(aes(fill=SampleType),outlier.colour = NA) 
p + facet_wrap(.~variable, scales="free") 
dev.off();

enter image description here

added 87 characters in body
Source Link
bioinfonext
  • 393
  • 2
  • 14
Loading
added 17 characters in body
Source Link
bioinfonext
  • 393
  • 2
  • 14
Loading
deleted 58 characters in body
Source Link
bioinfonext
  • 393
  • 2
  • 14
Loading
deleted 58 characters in body
Source Link
bioinfonext
  • 393
  • 2
  • 14
Loading
deleted 661 characters in body
Source Link
bioinfonext
  • 393
  • 2
  • 14
Loading
added 27 characters in body
Source Link
bioinfonext
  • 393
  • 2
  • 14
Loading
added 51 characters in body
Source Link
bioinfonext
  • 393
  • 2
  • 14
Loading
Source Link
bioinfonext
  • 393
  • 2
  • 14
Loading