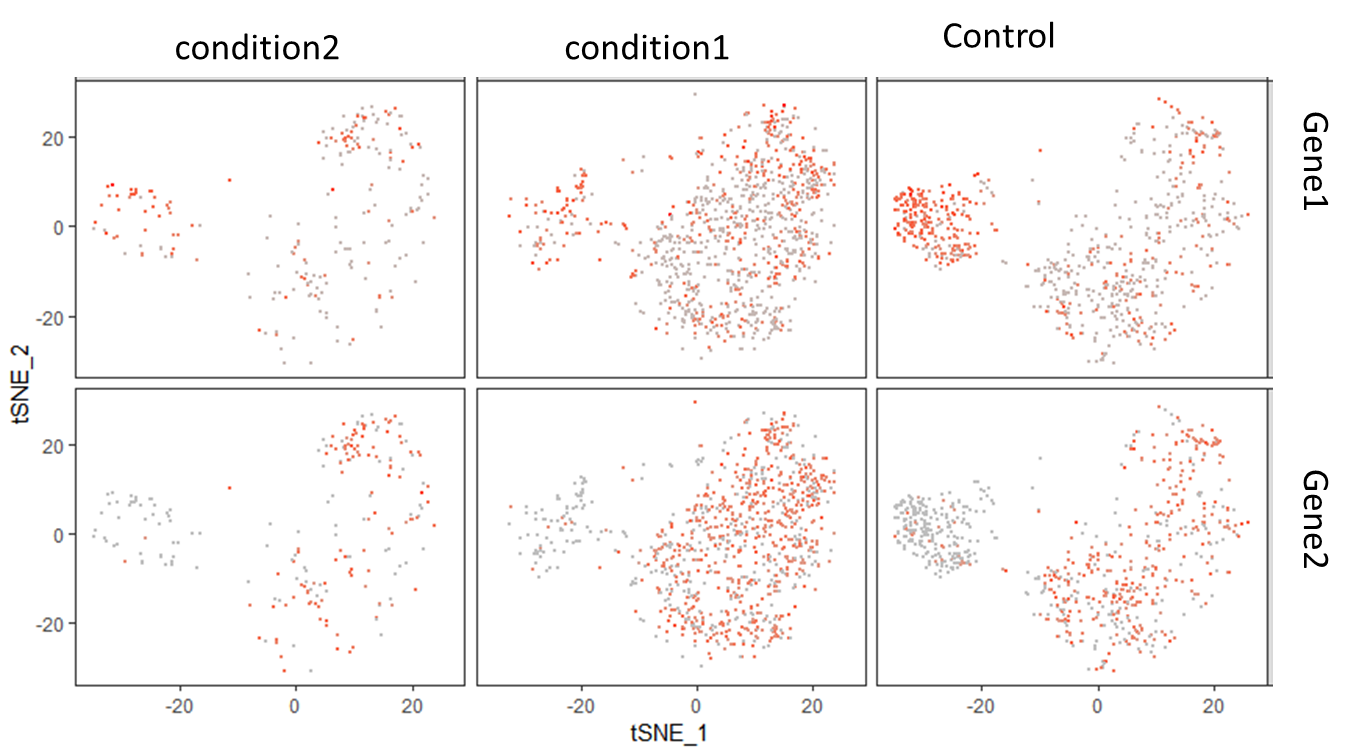
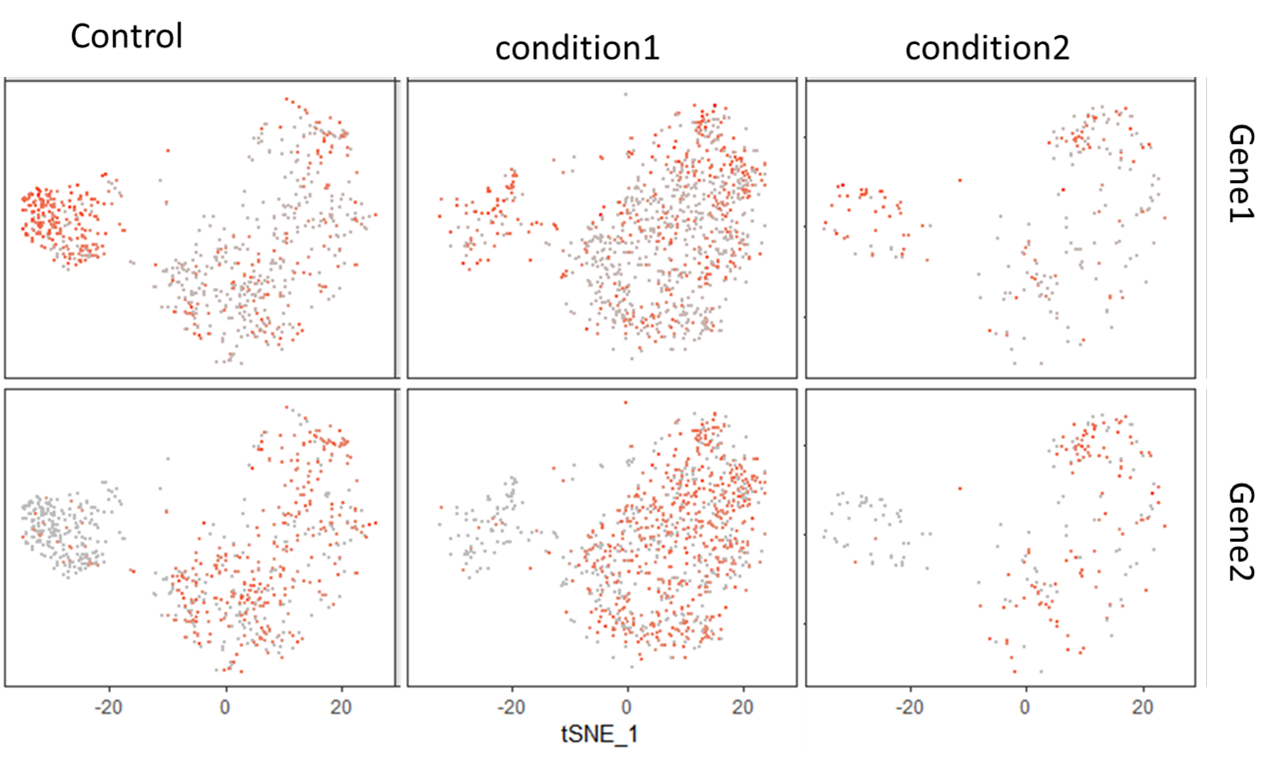
I am analysing singe cell sequence data and I have followed this tutorial, https://satijalab.org/seurat/pbmc3k_tutorial.html to perform QC and various differential analyses using the Seurat package on my data up till now.
How can I rearrange on the resulting plot, the order in which the groups of my samples appear when I use the FeatureHeatmap() function to visualise the differential gene expression of Gene1 and Gene2 across the cell clusters?
FeatureHeatmap(object = object, features.plot = c("Gene1", "Gene2"),
               group.by = "Conditions",
               pt.size = 0.25, key.position = "top",
               max.exp = 3)

