edited title
Link
gringer
  • 15.1k
  • 5
  • 24
  • 83

How do I add external labels and connecting lines to a Ternary plotPlot in R?

Bumped by Community user
added 89 characters in body
Source Link

enter image description here

enter image description here

added 37 characters in body
Source Link

I have plotted a triangular plot,that three dimensions of which represent three herbal strategies. One dimension represents the strategy of C (competitive plant), the second dimension “S” (stress tolerant plants) and the third dimension”R” (ruderal plants), as you can see in the image below,[![enter image description here][1]][1] the points on it represent the plant species. Now I am trying to write name of the plant species outside the triangle and connect with the arrow to the corresponding point. How do I do this work? Many thanks in advance as it would help me a lot in my work.

TernaryPlot()
#Plot two stylised plots side by side, and plot data
par(mfrow=c(1, 1), mar=rep(0.3, 4))
TernaryPlot(atip='C%', btip='R%', ctip='S%',
            point='UP', lab.cex=0.8, grid.minor.lines=0,
            grid.lty='solid', col='#FFFFFF', grid.col='GREY', 
            axis.col=rgb(0.1, 0.1, 0.1), ticks.col=rgb(0.1, 0.1, 0.1),
            padding=0.08)
data_points <- list("Bromus dantonia" = c(47,   59, 149),
                    "Calamagrosis psoudo phragmatis" = c(90,    102,    63),
                    "Carex diluta" = c(109, 64, 82),
                    "Carex divisa" = c(96,  99, 59),
                    "Carex pseudocyperus" = c(130,  71, 54),
                    "Carex stenophylla" = c(97, 98, 59),
                    "Catabrosa aquatica" = c(100,   5,  150),
                    "Centaurea iberica" = c(124,    85, 46),
                    "Cirsium hygrophilum" = c(158,  42, 55),
                    "Cladium mariscus" = c(159, 96, 0),
                    "cod2" = c(54,  82, 119),
                    "Cynodon dactylon" = c(121, 54, 80),
                    "Eleocharis palustri" = c(124,  100,    31),
                    "Epilobium parviflorum" = c(67, 80, 107),
                    "Eromopoa persica" = c(83,  15, 157),
                    "Funaria cf.microstoma" = c(8,  0,  247),
                    "Glaux maritime" = c(4, 196,    55),
                    "Hordeum brevisubulatum" = c(76,    70, 109),
                    "Hordeum glaucum" = c(40,   79, 136),
                    "Inula britannica" = c(95,  108,    51),
                    "Juncus articulatus" = c(107,   79, 69),
                    "Blysmus compressus" = c(81,    127,    47),
                    "Juncusinflexus"= c(149,    106,    0),
                    "Medicago polymorpha" = c(60,   86, 109),
                    "Mentha spicata" = c(150,   23, 82),
                    "Ononis spinosa" = c(66,    112,    77),
                    "Phragmites australis" = c(234, 0,  21),
                    "Plantago amplexicaulis" = c(108,   83, 64),
                    "Poa trivialis" = c(90, 28, 138),
                    "Polygonum paronychioides" = c(20,  12, 223),
                    "Potentila reptans" = c(106,    41, 108),
                    "Potentilla anserina" = c(105,  58, 91),
                    "Ranunculus grandiflorus" = c(129,  25, 101),
                    "Schoenus nigricans" = c(143,   91, 21),
                    "Setaria viridis" = c(10,   7,  238),
                    "Sonchus oleraceus" = c(178,    0,  77),
                    "Taraxacum officinale" = c(117, 28, 110),
                    "Trifolium repens" = c(94,  4,  157),
                    "Triglochin martima" = c(63,    96, 95),
                    "Veronica anagallis-aquatica" = c(55,   37, 163)
)
AddToTernary(points, data_points, pch=21, cex=1.2, 
             bg=vapply(data_points, 
                       function (x) rgb(x[1], x[2], x[3], 128, maxColorValue=255),
                       character(1))
)

AddToTernary(text, data_points, names(data_points), cex=0.8, font=1)
```[![enter image desc[![enter image description here][3]][3]ription here][2]][2]


  [1]: https://i.sstatic.net/NCzg7.jpg
  [2]: https://i.sstatic.net/08MHS.jpg
  [3]: https://i.sstatic.net/AmETk.jpg
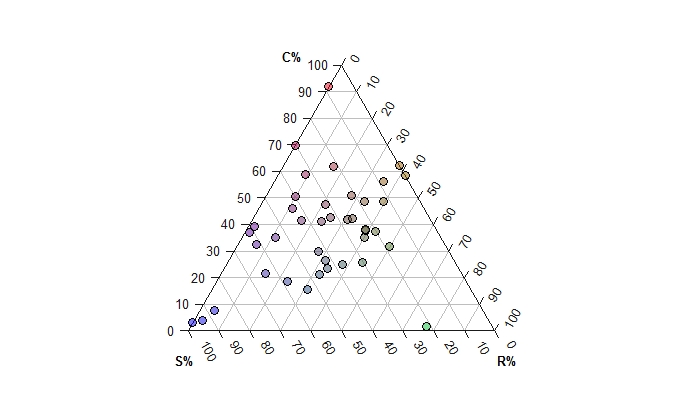
enter image description here

I have plotted a triangular plot,that three dimensions of which represent three herbal strategies. One dimension represents the strategy of C (competitive plant), the second dimension “S” (stress tolerant plants) and the third dimension”R” (ruderal plants), as you can see in the image below,[![enter image description here][1]][1] the points on it represent the plant species. Now I am trying to write name of the plant species outside the triangle and connect with the arrow to the corresponding point. How do I do this work? Many thanks in advance as it would help me a lot in my work.

TernaryPlot()
#Plot two stylised plots side by side, and plot data
par(mfrow=c(1, 1), mar=rep(0.3, 4))
TernaryPlot(atip='C%', btip='R%', ctip='S%',
            point='UP', lab.cex=0.8, grid.minor.lines=0,
            grid.lty='solid', col='#FFFFFF', grid.col='GREY', 
            axis.col=rgb(0.1, 0.1, 0.1), ticks.col=rgb(0.1, 0.1, 0.1),
            padding=0.08)
data_points <- list("Bromus dantonia" = c(47,   59, 149),
                    "Calamagrosis psoudo phragmatis" = c(90,    102,    63),
                    "Carex diluta" = c(109, 64, 82),
                    "Carex divisa" = c(96,  99, 59),
                    "Carex pseudocyperus" = c(130,  71, 54),
                    "Carex stenophylla" = c(97, 98, 59),
                    "Catabrosa aquatica" = c(100,   5,  150),
                    "Centaurea iberica" = c(124,    85, 46),
                    "Cirsium hygrophilum" = c(158,  42, 55),
                    "Cladium mariscus" = c(159, 96, 0),
                    "cod2" = c(54,  82, 119),
                    "Cynodon dactylon" = c(121, 54, 80),
                    "Eleocharis palustri" = c(124,  100,    31),
                    "Epilobium parviflorum" = c(67, 80, 107),
                    "Eromopoa persica" = c(83,  15, 157),
                    "Funaria cf.microstoma" = c(8,  0,  247),
                    "Glaux maritime" = c(4, 196,    55),
                    "Hordeum brevisubulatum" = c(76,    70, 109),
                    "Hordeum glaucum" = c(40,   79, 136),
                    "Inula britannica" = c(95,  108,    51),
                    "Juncus articulatus" = c(107,   79, 69),
                    "Blysmus compressus" = c(81,    127,    47),
                    "Juncusinflexus"= c(149,    106,    0),
                    "Medicago polymorpha" = c(60,   86, 109),
                    "Mentha spicata" = c(150,   23, 82),
                    "Ononis spinosa" = c(66,    112,    77),
                    "Phragmites australis" = c(234, 0,  21),
                    "Plantago amplexicaulis" = c(108,   83, 64),
                    "Poa trivialis" = c(90, 28, 138),
                    "Polygonum paronychioides" = c(20,  12, 223),
                    "Potentila reptans" = c(106,    41, 108),
                    "Potentilla anserina" = c(105,  58, 91),
                    "Ranunculus grandiflorus" = c(129,  25, 101),
                    "Schoenus nigricans" = c(143,   91, 21),
                    "Setaria viridis" = c(10,   7,  238),
                    "Sonchus oleraceus" = c(178,    0,  77),
                    "Taraxacum officinale" = c(117, 28, 110),
                    "Trifolium repens" = c(94,  4,  157),
                    "Triglochin martima" = c(63,    96, 95),
                    "Veronica anagallis-aquatica" = c(55,   37, 163)
)
AddToTernary(points, data_points, pch=21, cex=1.2, 
             bg=vapply(data_points, 
                       function (x) rgb(x[1], x[2], x[3], 128, maxColorValue=255),
                       character(1))
)

AddToTernary(text, data_points, names(data_points), cex=0.8, font=1)
```[![enter image desc[![enter image description here][3]][3]ription here][2]][2]


  [1]: https://i.sstatic.net/NCzg7.jpg
  [2]: https://i.sstatic.net/08MHS.jpg
  [3]: https://i.sstatic.net/AmETk.jpg
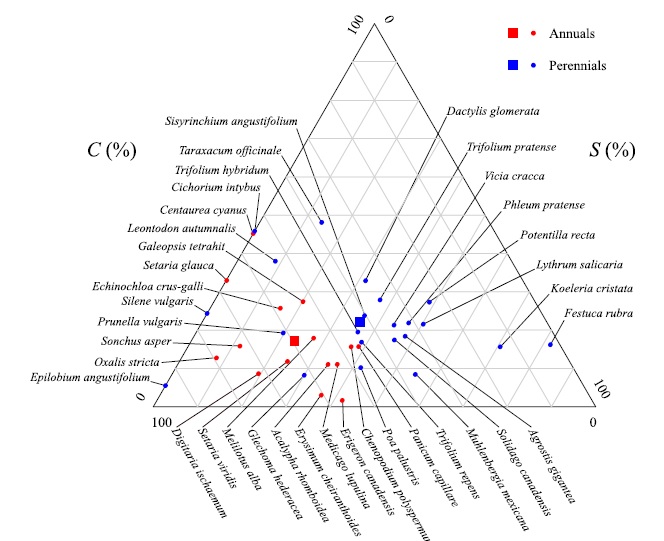
I have plotted a triangular plot,that three dimensions of which represent three herbal strategies. One dimension represents the strategy of C (competitive plant), the second dimension “S” (stress tolerant plants) and the third dimension”R” (ruderal plants), as you can see in the image below, the points on it represent the plant species. Now I am trying to write name of the plant species outside the triangle and connect with the arrow to the corresponding point. How do I do this work? Many thanks in advance as it would help me a lot in my work.

TernaryPlot()
#Plot two stylised plots side by side, and plot data
par(mfrow=c(1, 1), mar=rep(0.3, 4))
TernaryPlot(atip='C%', btip='R%', ctip='S%',
            point='UP', lab.cex=0.8, grid.minor.lines=0,
            grid.lty='solid', col='#FFFFFF', grid.col='GREY', 
            axis.col=rgb(0.1, 0.1, 0.1), ticks.col=rgb(0.1, 0.1, 0.1),
            padding=0.08)
data_points <- list("Bromus dantonia" = c(47,   59, 149),
                    "Calamagrosis psoudo phragmatis" = c(90,    102,    63),
                    "Carex diluta" = c(109, 64, 82),
                    "Carex divisa" = c(96,  99, 59),
                    "Carex pseudocyperus" = c(130,  71, 54),
                    "Carex stenophylla" = c(97, 98, 59),
                    "Catabrosa aquatica" = c(100,   5,  150),
                    "Centaurea iberica" = c(124,    85, 46),
                    "Cirsium hygrophilum" = c(158,  42, 55),
                    "Cladium mariscus" = c(159, 96, 0),
                    "cod2" = c(54,  82, 119),
                    "Cynodon dactylon" = c(121, 54, 80),
                    "Eleocharis palustri" = c(124,  100,    31),
                    "Epilobium parviflorum" = c(67, 80, 107),
                    "Eromopoa persica" = c(83,  15, 157),
                    "Funaria cf.microstoma" = c(8,  0,  247),
                    "Glaux maritime" = c(4, 196,    55),
                    "Hordeum brevisubulatum" = c(76,    70, 109),
                    "Hordeum glaucum" = c(40,   79, 136),
                    "Inula britannica" = c(95,  108,    51),
                    "Juncus articulatus" = c(107,   79, 69),
                    "Blysmus compressus" = c(81,    127,    47),
                    "Juncusinflexus"= c(149,    106,    0),
                    "Medicago polymorpha" = c(60,   86, 109),
                    "Mentha spicata" = c(150,   23, 82),
                    "Ononis spinosa" = c(66,    112,    77),
                    "Phragmites australis" = c(234, 0,  21),
                    "Plantago amplexicaulis" = c(108,   83, 64),
                    "Poa trivialis" = c(90, 28, 138),
                    "Polygonum paronychioides" = c(20,  12, 223),
                    "Potentila reptans" = c(106,    41, 108),
                    "Potentilla anserina" = c(105,  58, 91),
                    "Ranunculus grandiflorus" = c(129,  25, 101),
                    "Schoenus nigricans" = c(143,   91, 21),
                    "Setaria viridis" = c(10,   7,  238),
                    "Sonchus oleraceus" = c(178,    0,  77),
                    "Taraxacum officinale" = c(117, 28, 110),
                    "Trifolium repens" = c(94,  4,  157),
                    "Triglochin martima" = c(63,    96, 95),
                    "Veronica anagallis-aquatica" = c(55,   37, 163)
)
AddToTernary(points, data_points, pch=21, cex=1.2, 
             bg=vapply(data_points, 
                       function (x) rgb(x[1], x[2], x[3], 128, maxColorValue=255),
                       character(1))
)

AddToTernary(text, data_points, names(data_points), cex=0.8, font=1)

enter image description here

added 37 characters in body
Source Link
Loading
added 37 characters in body
Source Link
Loading
edited tags
Link
M__
  • 13k
  • 5
  • 28
  • 47
Loading
added 3401 characters in body
Source Link
Loading
added 3401 characters in body
Source Link
Loading
added 85 characters in body
Source Link
Loading
added 85 characters in body
Source Link
Loading
Source Link
Loading