I am using Minimap2 (v2.26-r1175) in Linux to generate a sequence alignment between the Streptomyces coelicolor A3(2) chromosome (ref.fa) and the Mycobacterium tuberculosis chromosome (query.fa). My desired output is a PAF (Pairwise mApping Format) file.
The general way to align reference and query sequences with Minimap2 is the following:
minimap2 ref.fa query.fa > approx_mapping.paf
# OR equivalently...
minimap2 -k15 -w10 ref.fa query.fa > approx_mapping.paf
You can get Minimap2 to generate custom CIGAR tags (cg:) in the PAF by adding the -c flag:
minimap2 -c ref.fa query.fa > approx_mapping_cigar.paf
# OR equivalently...
minimap2 -c -k15 -w10 ref.fa query.fa > approx_mapping_cigar.paf
Moving to an R environment [with the intention of downstream data visualization], you can quickly assess the number of observations in each object (a.k.a. rows in each dataframe) with dim():
file1 <- "approx_mapping.paf"
paf_basic <- read.table(file1, sep = "\t", fill = TRUE,
                        col.names = paste0("V",seq_len(max(count.fields(file1, sep = "\t")))))
dim(paf_basic)
[1] 205  18

file2 <- "approx_mapping_cigar.paf"
paf_cigar <- read.table(file2, sep = "\t", fill = TRUE,
                        col.names = paste0("V",seq_len(max(count.fields(file2, sep = "\t")))))
dim(paf_cigar)
[1] 200  24
Note the unqiue way we have to read the PAF files into R using read.table() to ensure no columns are cut off and added to new rows. This is because read.table() is designed to examine only the first five lines of an input file to determine the number of columns in the dataframe. Any columns on lines beyond the fifth line that exceed the initially determined count are appended to a new row. In the case of PAF files generated by Minimap2 with CIGAR tags, the number of columns can vary per line, which makes this necessary.
With the default settings, I get 205 observations and with the addition of the CIGAR flag, I get 200 observations.
Why do I get fewer computed alignments when the CIGAR tags are added? I would expect the alignments between the reference and query to be identical between these runs.
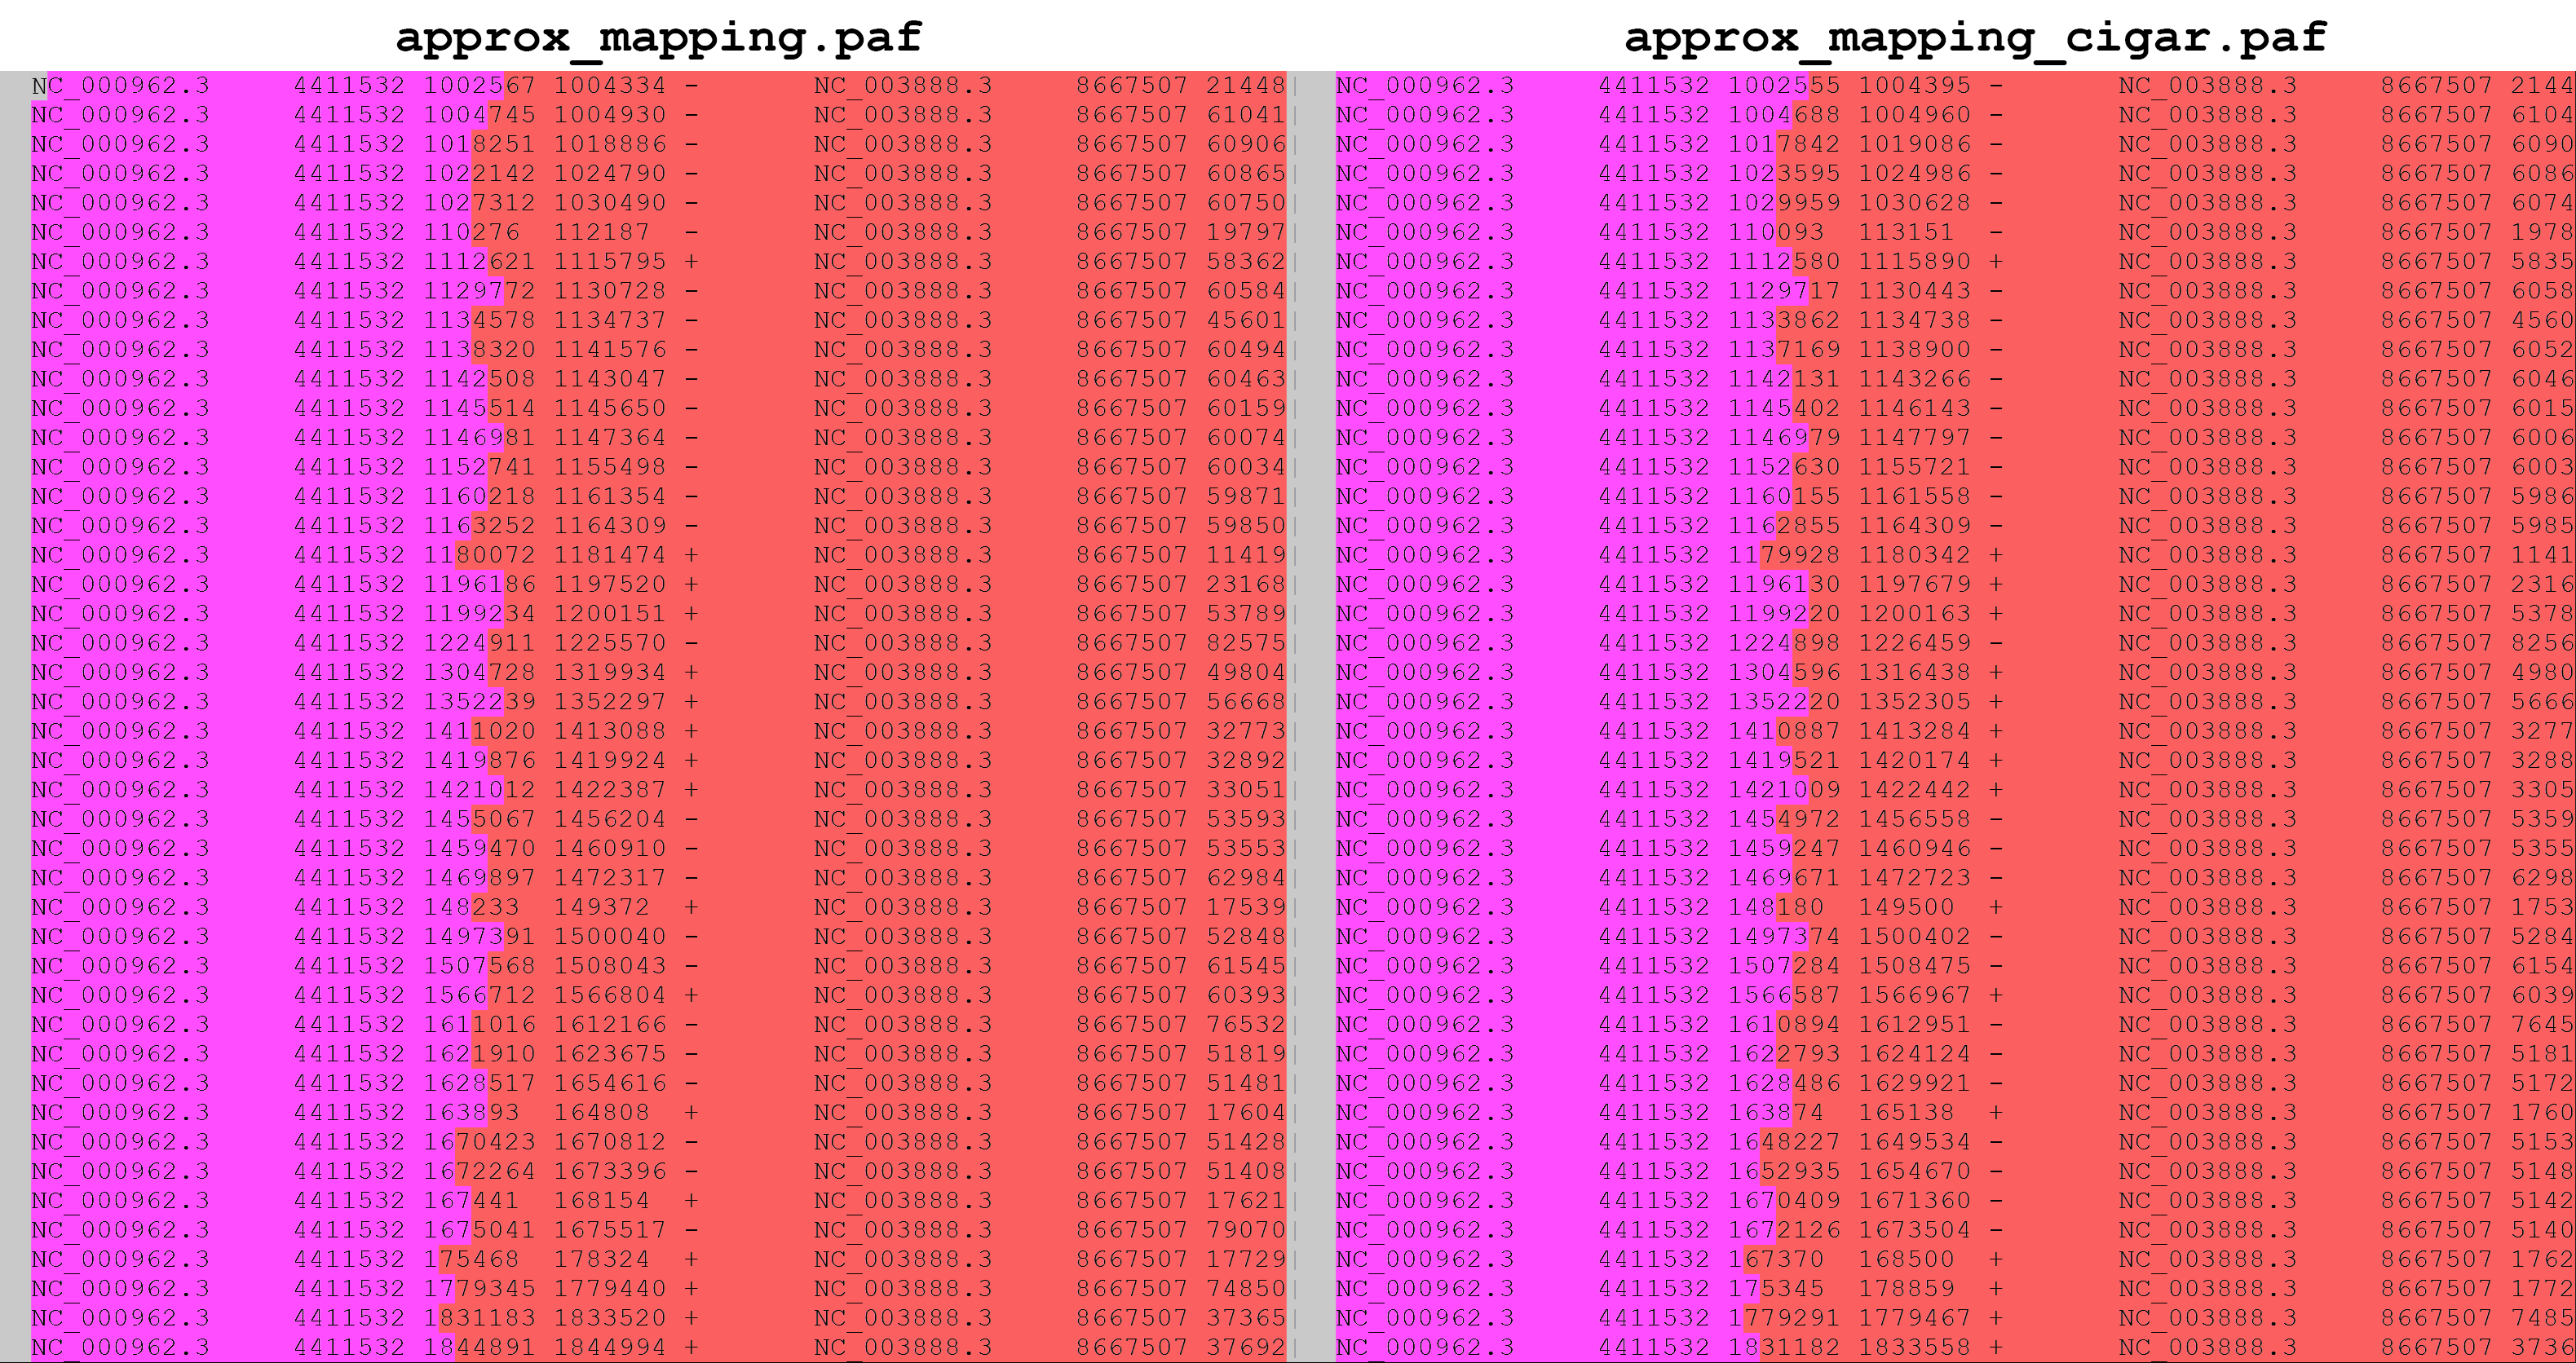
Comparing the PAF files (directly generated by minimap2) after sorting (sort -k3,3 -k4,4) using vimdiff reveals that the alignments computed between the default and CIGAR setting runs are largely similar, but not identical:
Note that the image above only shows the first 44 rows of both files.
Due to the small differences seen in alignment coordinates between these two dataframes (see fields $3 and $4 in the vimdiff screenshot), it is NOT trivial to determine which five observations (rows) are new alignments computed when using the CIGAR flag -c.
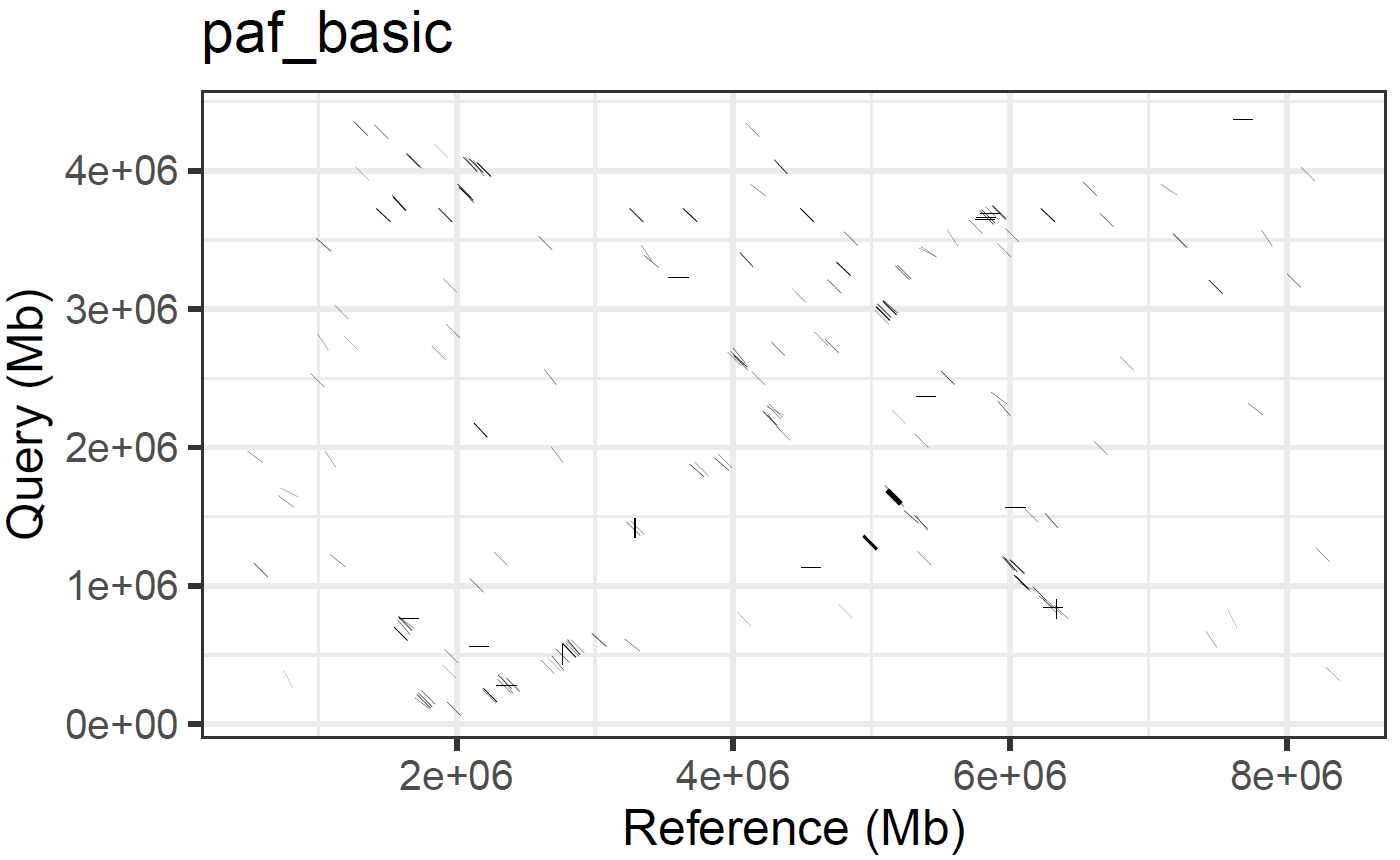
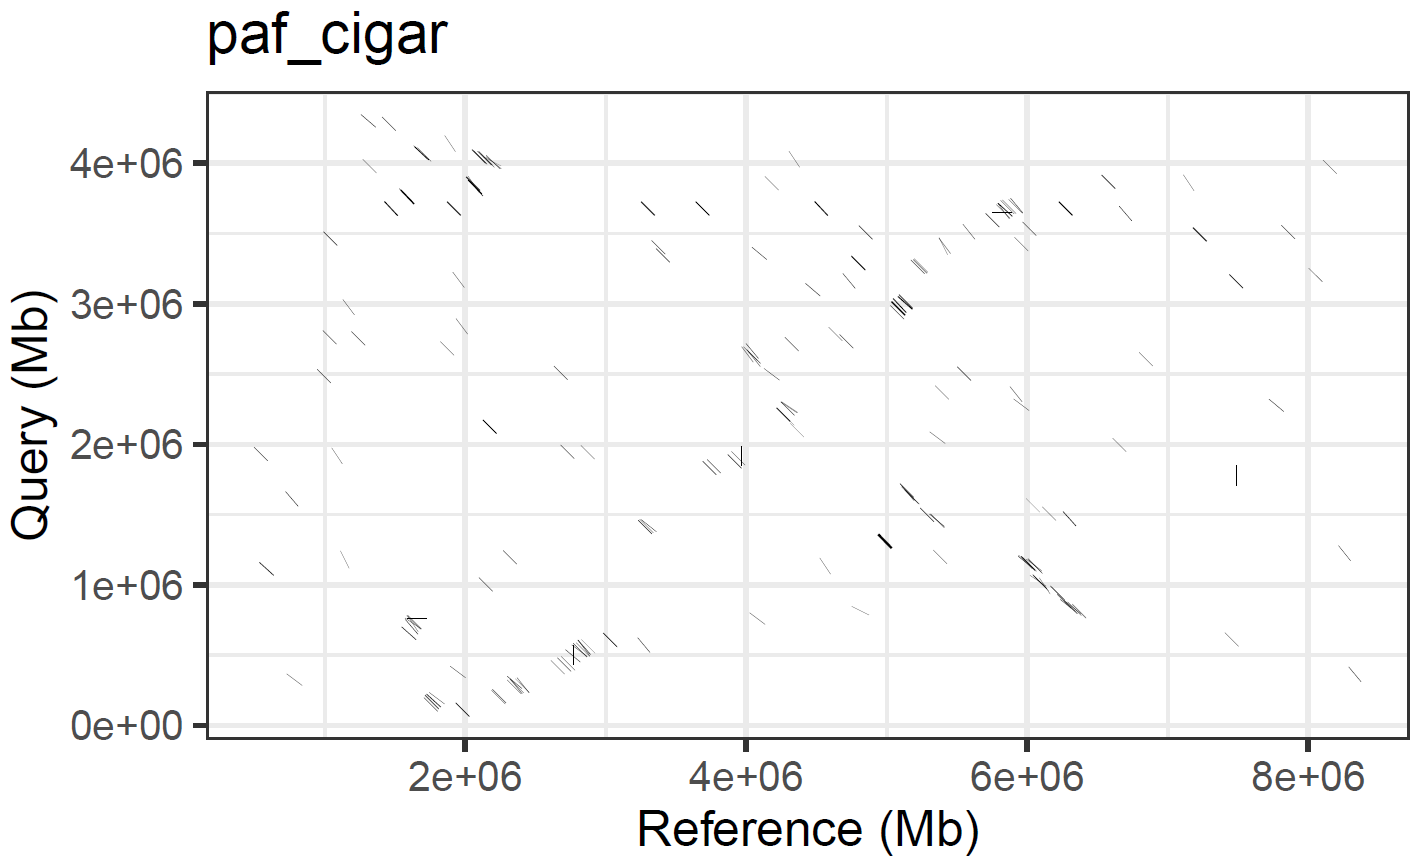
Plotting these dataframes confirms that the paf_basic and paf_cigar objects do, in fact, contain some different sequence alignments from each other:
library("ggplot2")
ggplot(data = paf) +
  geom_segment(aes(x = V8, xend = V9, y = V3, yend = V4), size = 2) +
  labs(title = "paf_name", x = "Reference (Mb)", y = "Query (Mb)") +
  coord_fixed(ratio = 1) +
  theme_bw()
So, it appears as though minimap2 -c produces a slightly different alignment than minimap2, which is surprising to me and begs the question: Which alignment is better or preferable?


read.tableis parsing the PAF incorrectly? That seems most likely given your observation about tag-only rows. $\endgroup$dplyr::semi_join(paf_basic, paf_cigar, by=c("V3","V4","V8","V9"))). Based on the graphs included in the question (a recent edit), it seems that many of the alignment coordinates are close, but not identical. Unfortunately, thedput()outputs for these data frames are too large for SO question character limits. However, I have verified that the*.paffiles match thepafR objects produced byread.table(). $\endgroup$vimdiff? It should not be too hard to find the differences leading to 2 extra rows. But IDK exactly what is going on. If you've demonstrated that adding the-coption changes the alignments themselves, that certainly sounds wrong. I'd suggest posting an issue on minimap2 github, Heng is pretty responsive. (If you do so, be sure to link to the issue here!) $\endgroup$vimdiffbefore. I gave it a go and found it immensely useful. I've updated the question to include a snapshot of the two files sorted and side-by-side in the program which reveals just how similar (but not identical) the data frames are. I'll look into posting the issue on theminimap2github. Thanks for taking time out of your day to ponder this issue and help troubleshoot with me. Cheers! $\endgroup$