4
$\begingroup$

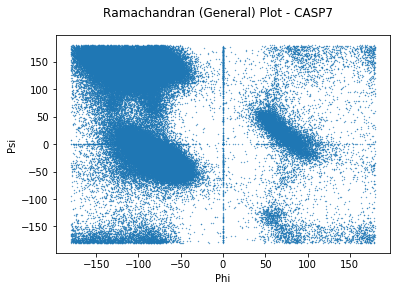
I'm a beginner to structural biology and for fun, calculated the tortional angles of some 100, 000 proteins. Here is my Ramachandran plot: enter image description here
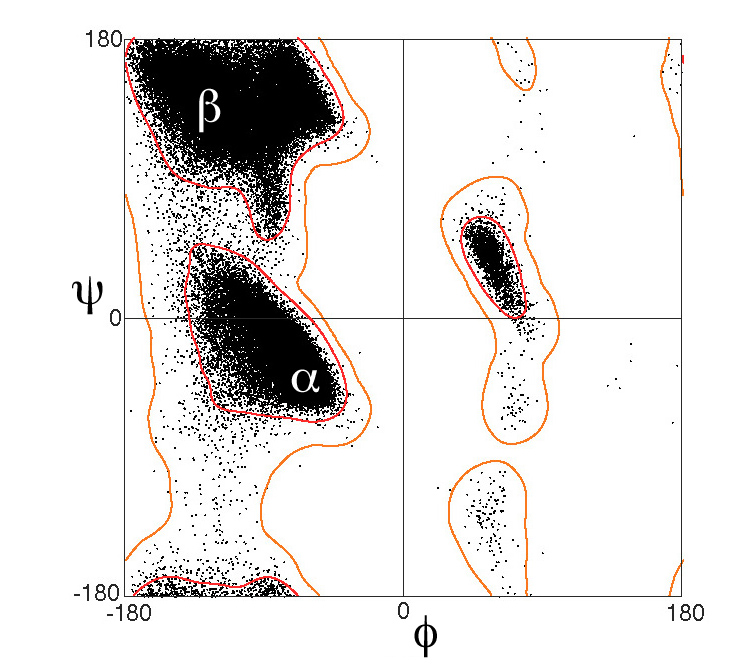
When I went to look for "canonical" Ramachandran plots, I discovered most researchers overlay a "contour" plot of allowed torsional angles (see below). My two questions are:

  • How are the distributions (ie. countours) of protein secondary structures calculated/derived? (ie. How do I "cluster" these into beta-sheets, alpha helices?)
  • How can I derive them myself?

enter image description here

$\endgroup$
4
  • $\begingroup$ You have already calculated you ψ and φ angles, hence your plot and you simply wish to do a contour map, correct? A contour map is a 2D histogram basically. There are many plotting programs. I use plotly, eg. plotly/contour. Your scatter plot looks like it's in MS Excel blue, but with Matlab style ticks set outwards. For the former, I have zero idea, while for the latter there is a function called contour. So could you specify the program? $\endgroup$ Commented Mar 30, 2020 at 16:02
  • $\begingroup$ Alternative, a commonly done thing is setting the alpha of the markers to something like 0.2 so that the overlapping ones are shown better. And also worth mentioning, that hexbin plots are becoming increasing popular this year for 2D histograms (via ggplots or py matplotlib) $\endgroup$ Commented Mar 30, 2020 at 16:06
  • $\begingroup$ Hi @MatteoFerla, thanks for your response. To clarify, the plot was generated in matplotlib. I have a better appreciation for how the plot is generated, but my question is: how do I know which cluster belongs to alpha helix, beta pleated sheets, etc. $\endgroup$
    – batlike
    Commented Mar 30, 2020 at 18:31
  • $\begingroup$ It is derived from the crystal structure and is a known variable. It can be spotted by eye by plotting the scatter plot (or hexbin plot...) with the data filtered by secondary structure. There is no fancy k-mer clustering of similar needed. Alternatively it can be argued a priori: residues on a β sheet go up-down so the ψ must be about 180°, while the turn on a helix is 3 and a bit, so must be about 60 °... $\endgroup$ Commented Mar 30, 2020 at 20:30

1 Answer 1

3
$\begingroup$

To expand on Matteo Ferla's comment as an answer, there are two approaches to getting these "allowed" contours:

  1. From probabilities found in observed crystal structures. You could imagine plotting a Ramachandran plot for the whole PDB and colouring the points by assigned secondary structure from DSSP. The contours would then be regions that encompass e.g. 99% of alpha-helical residues, or 99% of all residues. In doing this you would notice for example that glycine can adopt more regions of the Ramachandran space that other amino acids. PROCHECK is software that scores a protein based partly on the likelihood of the phi/psi angles of each residue.

  2. From reasoning about the chemistry of the secondary structure of proteins. Only certain phi/psi combinations allow the i -> i + 4 pattern in an alpha-helix or the alternating up/down sidechain pattern in a beta-strand.

$\endgroup$
1
  • 1
    $\begingroup$ Thanks @jgreener! The plot above is a portion of PDB, but captures something on the order of 10^5 proteins. I can already make out what appears to match the secondary structures. I'm curious how I can rigorously derive the probability distributions from crystal structures, as an exercise! $\endgroup$
    – batlike
    Commented Apr 6, 2020 at 14:04

Your Answer

By clicking “Post Your Answer”, you agree to our terms of service and acknowledge you have read our privacy policy.

Not the answer you're looking for? Browse other questions tagged or ask your own question.