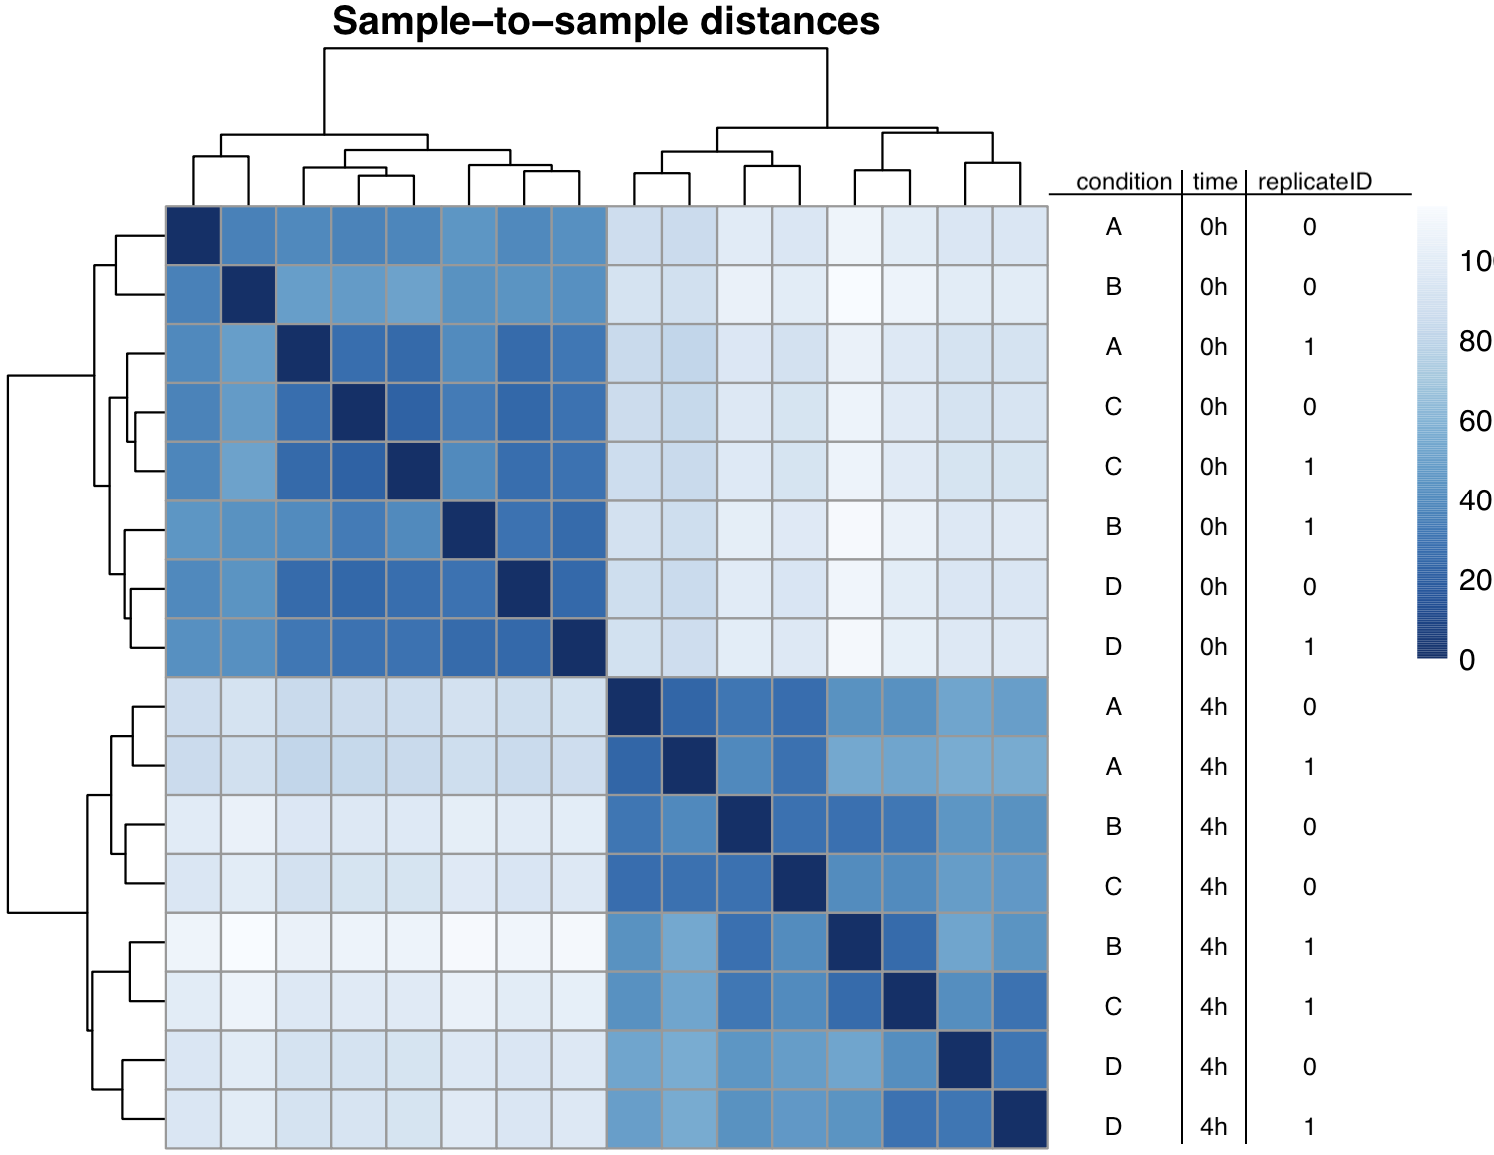
In summary you basically have noisy data and to simply answer your question it depends on the genetic diversity of the samples you are dealing with. Note, from my recollection this was confusing to start with because the "replicates" column was labeled as "treatment", but I could be wrong.
Revised answer, firstly there is zero stationarity - thus its a straight time-series.
Summary As a time series
- The statistical noise between A and D is lower than the difference in phenotypic expression between each and all othe replicates in the analysis ABCD - FOR DAY 0 VERSUS DAY
4, so they cluster and are distinct.
- The statistical noise between B and C is greater than the phenotypic variation between their expression profiles for DAY 0 to DAY 4. I suspect they are genetically very similar. Thats the conclusion, you can spice it up with different analysis, but I'd leave it because might find a lack of statistical significance in your core observations (A and D).
- Within the time-points the data is very noisy and doesn't appear to show a distinct signal. Thats okay, this is essentially a time series.
- Sample D is distinct in all scenarios (which is good)
Result To reiterate and expand a bit, the result you have is that sample A and D biological replicates are consisent within the analysis you are performing, i.e. day 0 verses day 4 (below). Thus they cluster together and this is proof of distinct phenotypes above the statistical noise (A with A and D with D). An intra-time point dendrogram would have a different result. The replicates samples B and C are not consistent and the interpretation is that the phenotypic expression profiles are so similar they are essentially identical within the boundaries of statistical noise.
Analysis The dendrogram is combines day 0 to day 4 analysis with day 0 to day 0 analysis and day 4 to day 4 analysis. HOWEVER, the clustering algorithm will correct for this and separate based on the largest distance (day 0 versus day 4). The signal that you get in your dendrogram is the largest signal in the data set which is day 0 vs day 4, and this is how UPGMA clustering works (I probably have previous posts on the statistical algorithm of UPGMA). So actually that is fine.
Advice With data this noisy I'd go no further in attempting to deploy critical probablity (a p value) because this data could be the result of a complex distribution. This would require a statistician. Personally
I'd upload the PCA as a separate post, but its just my opinion, because UPGMA versus eigenvalue based PCA are statistically quite different approaches.
