I'm trying to plot a heat map for a "GSE133399", I retrieved the GSE using GEOquery package and then assigned to an object and then tried to plot a heatmap, but I was not successful, I used the following code in RStudio:
install.packages("BiocManager")
BiocManager::install("GEOquery")
library(GEOquery)
## change my_id to be the dataset that you want.
my_id <- "GSE133399"
gse <- getGEO(my_id)
length(gse)
gse <- gse[[1]]
gse
pData(gse) ## print the sample information
fData(gse) ## print the gene annotation
exprs(gse) ## print the expression data

## exprs get the expression levels as a data frame and get the distribution
summary(exprs(gse))
exprs(gse) <- log2(exprs(gse))
boxplot(exprs(gse),outline=FALSE)
library(dplyr)
sampleInfo <- pData(gse)
sampleInfo
## source_name_ch1 and characteristics_ch1.1 seem to contain factors we might need for the analysis. Let's pick just those columns

sampleInfo <- select(sampleInfo, source_name_ch1,characteristics_ch1.1)

## Optionally, rename to more convenient column names
sampleInfo <- rename(sampleInfo,group = source_name_ch1, patient=characteristics_ch1.1)
sampleInfo
install.packages("pheatmap")
library(pheatmap)
## argument use="c" stops an error if there are any missing data points

corMatrix <- cor(exprs(gse),use="c")
I get this error:
Error in cor(exprs(gse), use = "c") : no complete element pairs
I also tried this:
corMatrix <- cor(exprs(gse),use="c", use="complete.obs")
I get this error:
Error in cor(exprs(gse), use = "c", use = "complete.obs") :
  formal argument "use" matched by multiple actual arguments
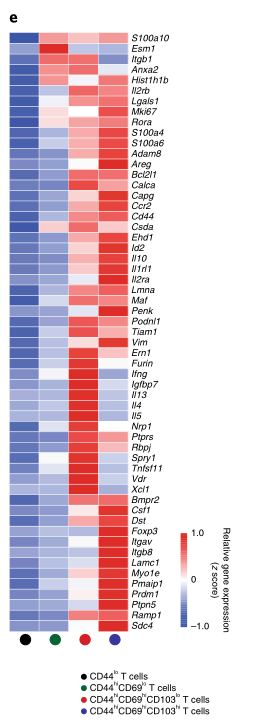
I want to achieve this plot:
