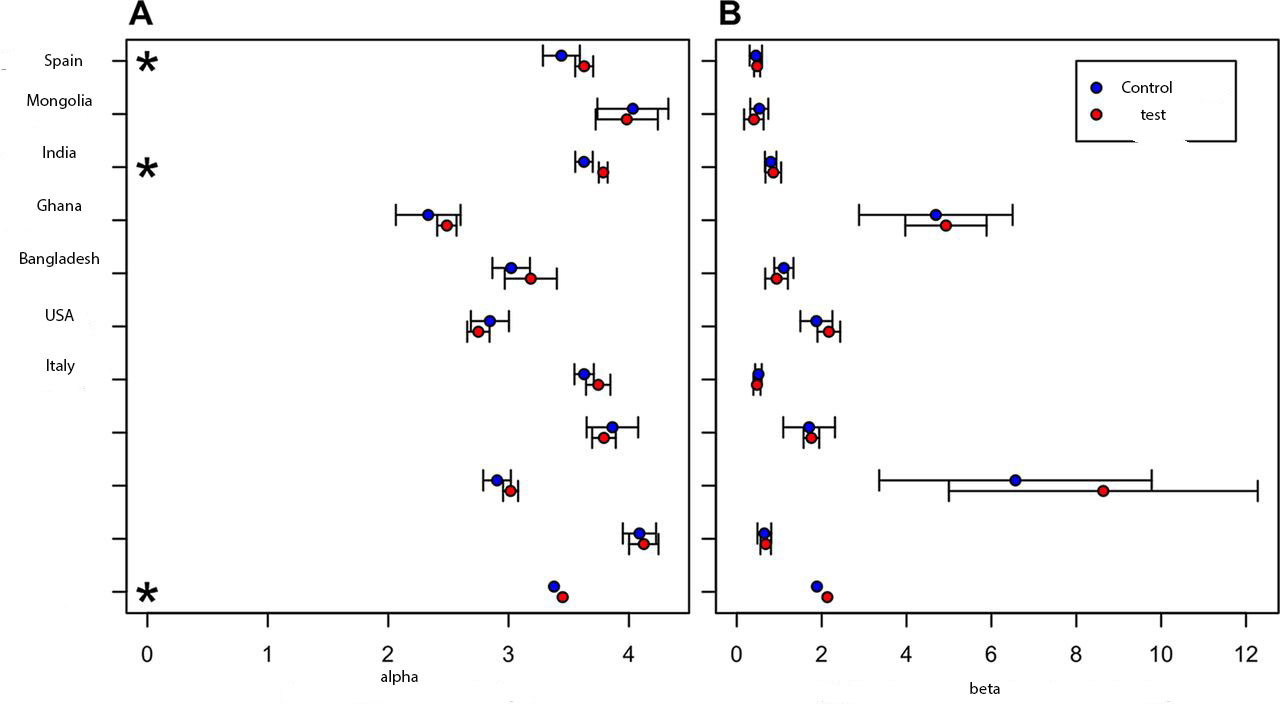
I have data from different countries from two groups of samples (control and test). And, calculated three different indices alpha, beta and gamma. I have a large dataframe containing all the data. Here is a reproducible example of my dataframe (df):
df <- structure(list(
    SampleID = c("SRR490_profile", "SRR467268_profile",
                 "SRR467265_profile", "SRR467264_profile",
                 "SRR467263_profile", "SRR467258_profile",
                 "SRR467250_profile", "SRR467244_profile",
                 "SRR467242_profile", "SRR467227_profile",
                 "ERR710432_profile", "ERR710430_profile",
                 "ERR710429_profile", "SRR232646_profile",
                 "SRR232622_profile", "SRR232619_profile",
                 "SRR232617_profile", "SRR232616_profile",
                 "SRR232614_profile", "SRR232612_profile",
                 "HJ4386_profile", "HJ4382_profile",
                 "HJ4380_profile", "HJ4379_profile",
                 "HJ4377_profile", "HJ4375_profile",
                 "HJ4374_profile", "HJ4373_profile",
                 "HJ4372_profile", "HJ4370_profile",
                 "KLM3246730_profile", "KLM3246729_profile",
                 "KLM3246725_profile", "KLM3246722_profile",
                 "KLM3246721_profile", "KLM3246714_profile",
                 "KLM3246713_profile", "KLM3246712_profile",
                 "KLM3246711_profile", "KLM3246705_profile"),
    type = c("test", "control", "control", "control",
             "control", "test", "test", "test", "control",
             "control", "control", "test", "control",
             "control", "control", "control", "control",
             "test", "control", "test", "control", "control",
             "control", "control", "control", "test",
             "control", "test", "test", "control", "control",
             "test", "test", "test", "control", "test",
             "control", "test", "test", "test"),
    variable = c("gamma", "alpha", "beta", "gamma", "alpha", "beta",
                 "gamma", "alpha", "beta", "gamma", "alpha", "alpha",
                 "beta", "gamma", "alpha", "beta", "gamma", "alpha",
                 "beta", "gamma", "alpha", "alpha", "alpha", "beta",
                 "beta", "gamma", "alpha", "beta", "gamma", "alpha",
                 "beta", "gamma", "alpha", "beta", "gamma", "alpha",
                 "beta", "gamma", "alpha", "beta"),
    value = c(95, 90, 109, 112, 128, 109, 90, 87, 90, 99, 129, 101, 113,
              100, 111, 102, 99, 105, 85, 94, 133, 117, 116, 83, 113, 126,
              90, 128, 107, 121, 88, 109, 82, 42, 67, 100, 88, 101, 127,
              115),
    StudyID = c("swiss", "swiss", "swiss", "swiss", "swiss", "swiss",
                "swiss", "swiss", "swiss", "swiss", "australian",
                "australian", "australian", "australian", "australian",
                "australian", "australian", "australian", "australian",
                "australian", "thai", "thai", "thai", "thai", "thai",
                "thai", "thai", "thai", "thai", "thai", "english",
                "english", "english", "english", "english", "english",
                "english", "english", "english", "english")),
    row.names = c(NA, -40L),
    class = c("tbl_df", "tbl", "data.frame"))
Now, I want an image for each index containing barplots for two groups (control and test) and Y-axis showing the StudyID names (i.e., country names) like the following (this image shows plots for two indices alpha and beta):
 Is this possible from my data? Can anyone give me a solution?
Thanks in advance