0
$\begingroup$

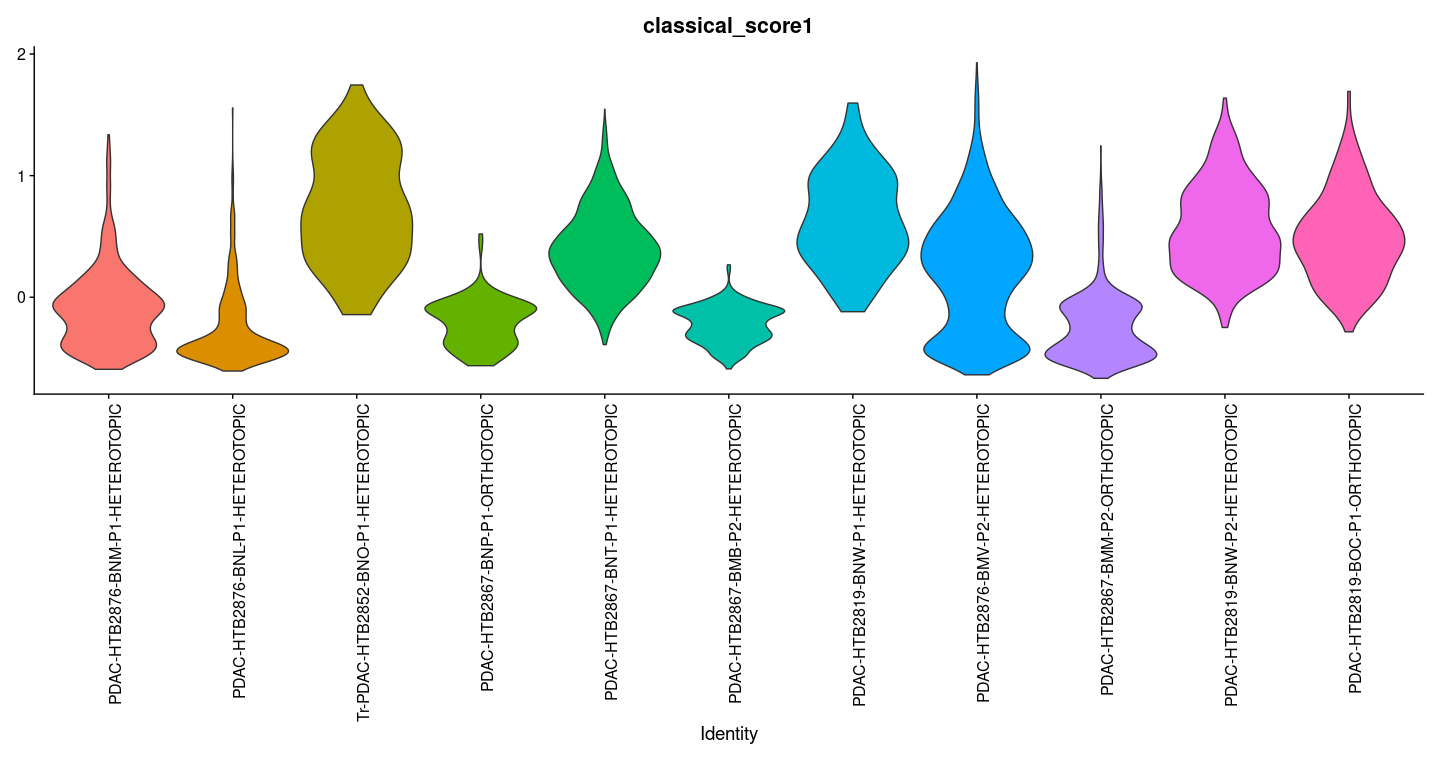
enter image description hereI'm trying to set the x-axis in my Violin Plot to go by each patient rather than it being scattered.

VlnPlot(obj, features = c("classical_basal"), pt.size = 0) + NoLegend() + theme(axis.text.x = element_text(angle = 90, hjust = 1))

The above code gives me the x-axis but there is no pattern or order. I would like the x-axis to be grouped with the HTB, for example ALL of the HTB2867 first, followed by HTB2876, etc...

$\endgroup$

2 Answers 2

2
$\begingroup$

Seurat does violin plots using ggplot, which orders based on the factor levels. You need to re-factor your grouping category so that the levels matches your preferred order:

# default level sort order is alphabetical
obj[["grouping"]] <- factor(unlist(obj[["grouping"]])) # refactor
VlnPlot(obj, group.by = "grouping", features = c("classical_basal"),
        pt.size = 0) +
  NoLegend() + theme(axis.text.x = element_text(angle = 90, hjust = 1))
$\endgroup$
1
  • $\begingroup$ How do I re-factor the grouping category? $\endgroup$
    – mmpp
    Commented Dec 3, 2021 at 21:43
0
$\begingroup$

It is difficult to say exactly what you would like to achieve without an example.

But if you would like an individual axis based on a factor like patient maybe you want to use facet_wrap for the Patient variable like in the example below?

library(ggplot2)

data <- iris

ggplot(data, aes(x=Sepal.Width, y=Sepal.Length, fill=Species)) +
  geom_violin() +
  facet_wrap(~Species, scales="free_x")
```
$\endgroup$
1
  • $\begingroup$ I have attached an image as well as a better description. $\endgroup$
    – mmpp
    Commented Sep 28, 2021 at 19:03

Your Answer

By clicking “Post Your Answer”, you agree to our terms of service and acknowledge you have read our privacy policy.

Not the answer you're looking for? Browse other questions tagged or ask your own question.