I want to see if there is any GC coverage bias in some paired-end Illumina human exome data. Update This is for a variant calling project. I used the CollectMultipleMetrics from GATK4 toolkit with -PROGRAM CollectGcBiasMetrics. An example of the command I used is:
gatk CollectMultipleMetrics -I input.bam -O prefix_dir_name -R input.ref_genome -PROGRAM CollectGcBiasMetrics -PROGRAM CollectAlignmentSummaryMetrics -PROGRAM CollectInsertSizeMetrics -PROGRAM QualityScoreDistribution -PROGRAM MeanQualityByCycle -PROGRAM CollectBaseDistributionByCycle
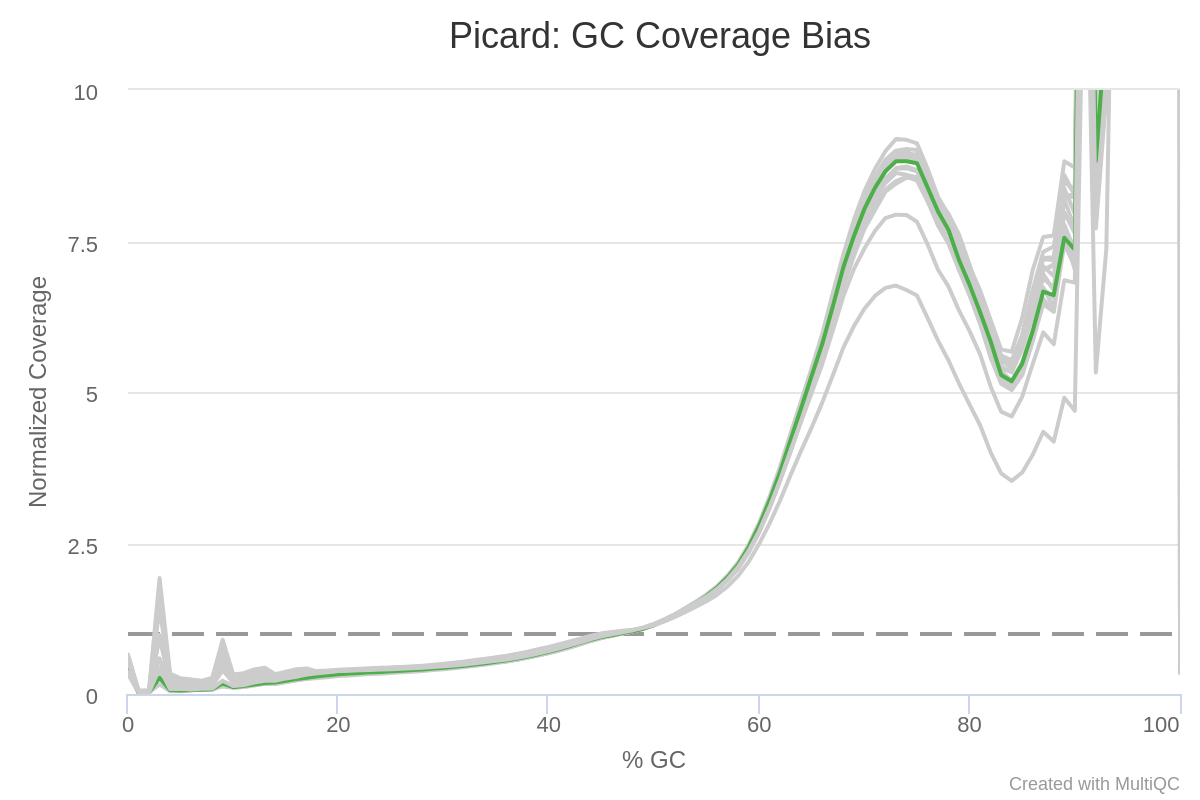
Update This is my result for the QC coverage bias with one sample highlighted:
 There seems to be a large bias. I would expect the peak to be around 50% for human. And those weird peaks around 90% are also puzzling to me. On the other hand, I am working with exome data so it might be logical to have a bias towards the higher values of GC% because you have reads on GC-rich exons?
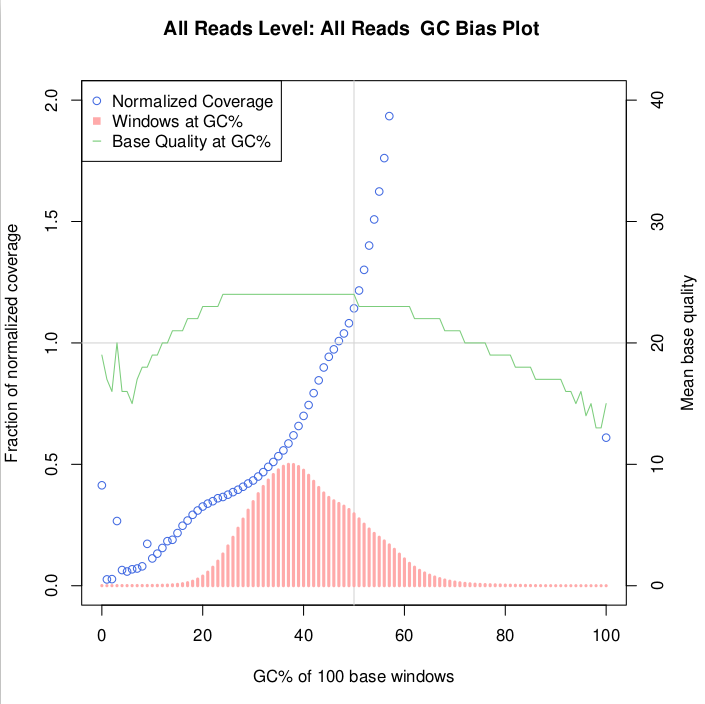
Update I have another plot with the bins produced by the above mentioned tool (.gc_bias.pdf)

Update first part of useful file (gc_bias.detail_metrics) which shows the reads per bin, as suggested by @Maximilian Press. This I will plot.
## htsjdk.samtools.metrics.StringHeader
# CollectMultipleMetrics --INPUT WESP_run/results/aligned/RM8398_MF_S8_MD.sorted.bam --OUTPUT WESP_run/results/aligned/post_alignment_QC/multiple_metrics/RM8398_MF_S8 --PROGRAM CollectAlignmentSummaryMetrics --P
ROGRAM CollectBaseDistributionByCycle --PROGRAM CollectInsertSizeMetrics --PROGRAM MeanQualityByCycle --PROGRAM QualityScoreDistribution --PROGRAM CollectGcBiasMetrics --REFERENCE_SEQUENCE /mnt/scratch_dir/deute
koe/projects/HP/WESPipe/workflow/resources/reference_genomes/hg38/alt_plus/GCA_000001405.15_GRCh38_full_plus_hs38d1_analysis_set.fna --ASSUME_SORTED true --STOP_AFTER 0 --METRIC_ACCUMULATION_LEVEL ALL_READS --IN
CLUDE_UNPAIRED false --VERBOSITY INFO --QUIET false --VALIDATION_STRINGENCY STRICT --COMPRESSION_LEVEL 2 --MAX_RECORDS_IN_RAM 500000 --CREATE_INDEX false --CREATE_MD5_FILE false --GA4GH_CLIENT_SECRETS client_sec
rets.json --help false --version false --showHidden false --USE_JDK_DEFLATER false --USE_JDK_INFLATER false
## htsjdk.samtools.metrics.StringHeader
# Started on: Sat Dec 03 14:25:15 CET 2022

## METRICS CLASS        picard.analysis.GcBiasDetailMetrics
ACCUMULATION_LEVEL      READS_USED      GC      WINDOWS READ_STARTS     MEAN_BASE_QUALITY       NORMALIZED_COVERAGE     ERROR_BAR_WIDTH SAMPLE  LIBRARY READ_GROUP
All Reads       ALL     0       139942  1326    19      0.413544        0.011357
All Reads       ALL     1       102412  61      17      0.025996        0.003328
All Reads       ALL     2       118957  74      16      0.02715 0.003156
All Reads       ALL     3       152181  929     20      0.266429        0.008741
All Reads       ALL     4       167732  248     16      0.06453 0.004098
All Reads       ALL     5       173319  232     16      0.058421        0.003836
All Reads       ALL     6       196365  304     15      0.067567        0.003875
All Reads       ALL     7       211217  343     17      0.070875        0.003827
All Reads       ALL     8       241125  441     18      0.079822        0.003801
All Reads       ALL     9       270272  1068    18      0.172463        0.005277
I have read a paper that uses the CollectGcBiasMetrics on exome data and they magically produce a plot without bias. I say magically because they don't explain how they use CollectGcBiasMetrics.
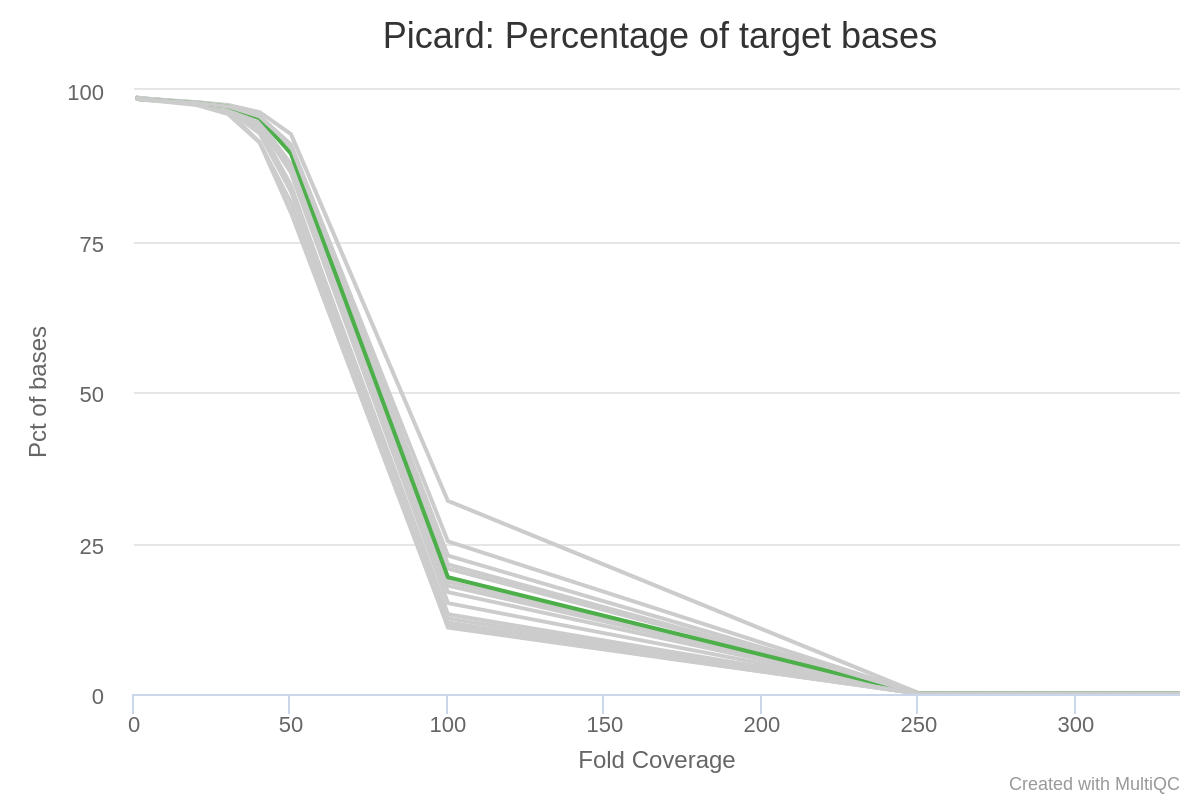
Update I added the target coverage plot.

Update Am I missing something? Should I, for instance, use my target regions in instead of the reference genome when using CollectGcBiasMetrics? I will try it, but I am not sure this is the correct thing to do... It is hard to find any workflow for exome data with gatk and particularly CollectGcBiasMetrics, which specifies to use the reference genome.
From the comment @Maximilian Press
Do you have on-instrument diagnostics? Did you run FastQC on the raw reads? What do the other picard metrics look like? Did you manually inspect your alignments (strongly recommended)? Do you actually have coverage of the exome?
I will see if I can get some instrument diagnostics. I did look at the alignments, and as far as I can tell I don't see anything weird? Just that it is very deeply sequenced. I do see some intronic regions, with some reads, but only a few reads compared to the many on the targets, which I think is a consequence of the (too) deep sequencing. The fastqc of the raw reads didn't look troubling, and it did not give me any warnings. The picard metrics I thought did not look out of the ordinary. There is good target coverage. Yes, it is sequenced quite deep. Also, the lab tech did tell me they over-cycled because they wanted to be sure to have all the regions/targets.
Update So this bias might be due to too deep sequencing? And another important question, can I still reliably use this data? If so, I guess I can perform some corrections like suggested here
Any help/suggestions would be very welcome. Thank you in advance.