The problem is that the enrichment score is modified based on whether the sets are positively or negatively associated, which means that an unbalanced set via either associative statistic or gene count (as is almost always the case) will lead to an incorrect total score.
Put in other words, the calculated score from the positive genes alters the calculated score from the negative genes.
Given this, it's a better idea to either separately calculate scores for the positive set and the negative set (this is the easiest approach, and works with existing methods), or (equivalently) recalculate enrichment score modifiers for positive and negative genes separately (i.e. adjust the graph) so that the zero point for the enrichment score crosses the zero point for association.
A common argument against this (when I have mentioned it to others) is that GSEA has always been done on the total gene set, so it makes sense to do it on the total gene set because it has always been done that way. I'm not a huge fan of the status-quo argument.
I alluded to this issue in this previous answer.
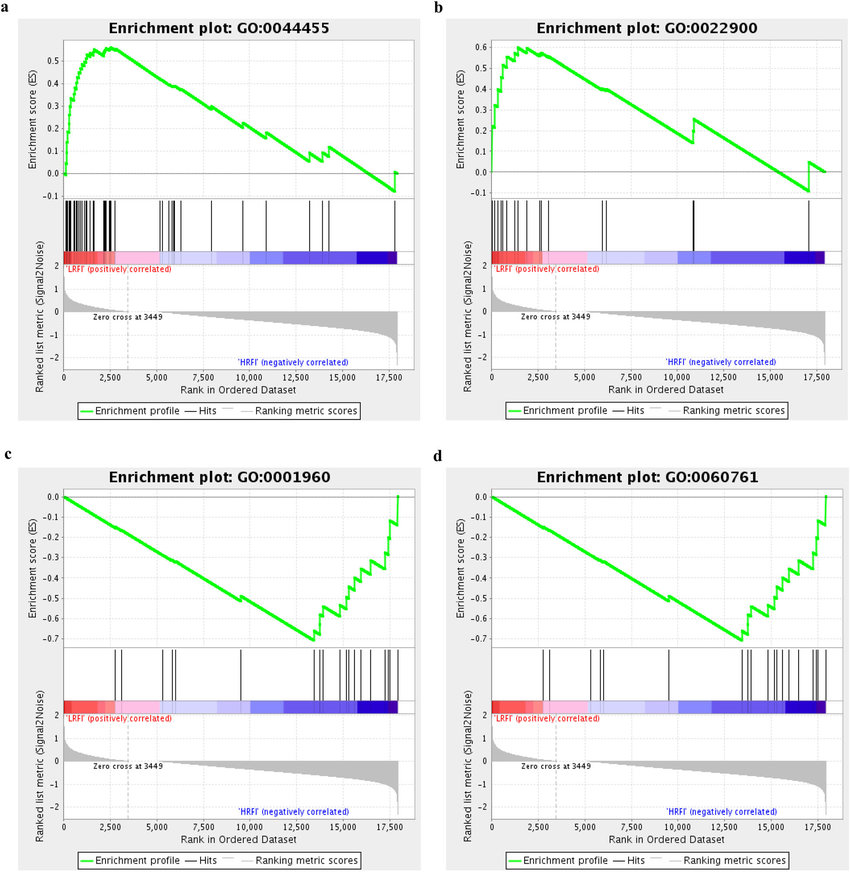
With regards to your figures:
a. Zero-point crossover is at an enrichment score of ~0.42, so the negative set will be underemphasised. It's not contributing much anyway (except for the one most negative gene at the end), so wouldn't affect the outcome much.
b. Zero-point crossover is at an enrichment score of ~0.45. Similar situation as in a.
c. Zero-point crossover is at an enrichment score of ~0.32. There aren't really any positive genes with substantial association scores, so no issue.
d. Plot looks to be identical to c, so the same comments apply.
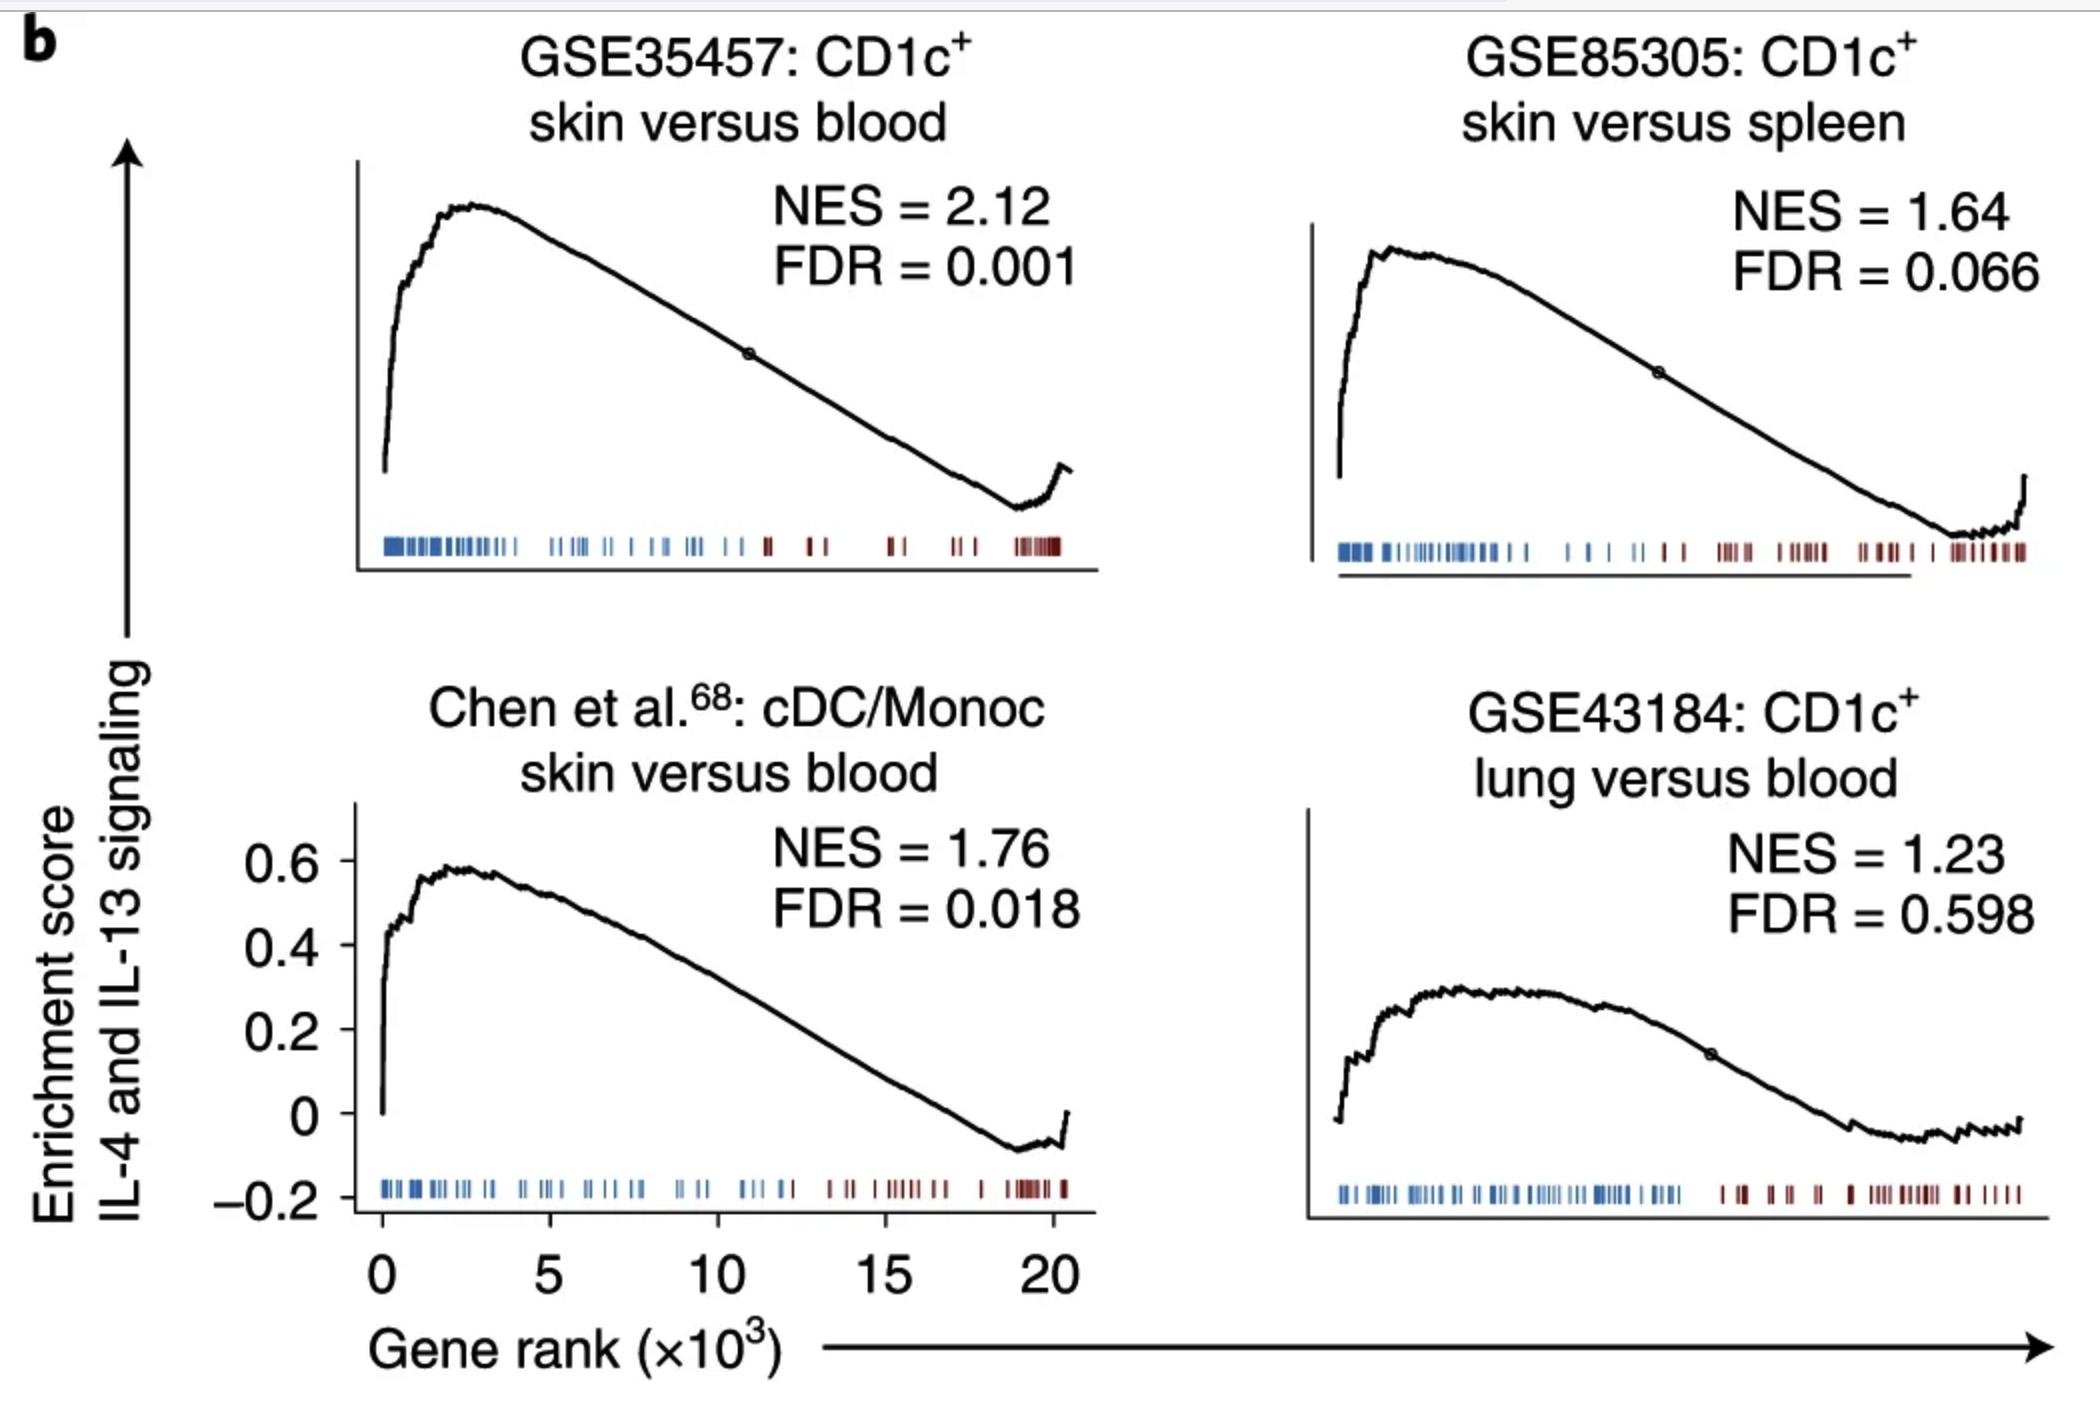
The scores are most affected when they have a lot of area on both sides of the Y axis. The top right plot of this sub-figure is an example of that, showing a sharp-ish tail on the negative side, so the calculated enrichment score for the negative peak is less extreme than it would be if only the negative genes were considered [source]:

The way it is phrased in the paper seems to suggest that it's the weighting that causes an issue.
Yes. If the positive genes are weighted separately from the negative genes, then the bias can be removed. I did briefly attempt a non-parametric weighting for GSEA (based on rank), but got too confused by the maths involved. Someone answered my question about it, but I haven't had to do any GSEA since then, so haven't actually verified if their solution works for me:
https://math.stackexchange.com/questions/3567714/probability-that-the-nth-highest-of-a-set-of-k-numbers-selected-from-m-numbers-h

