2
$\begingroup$

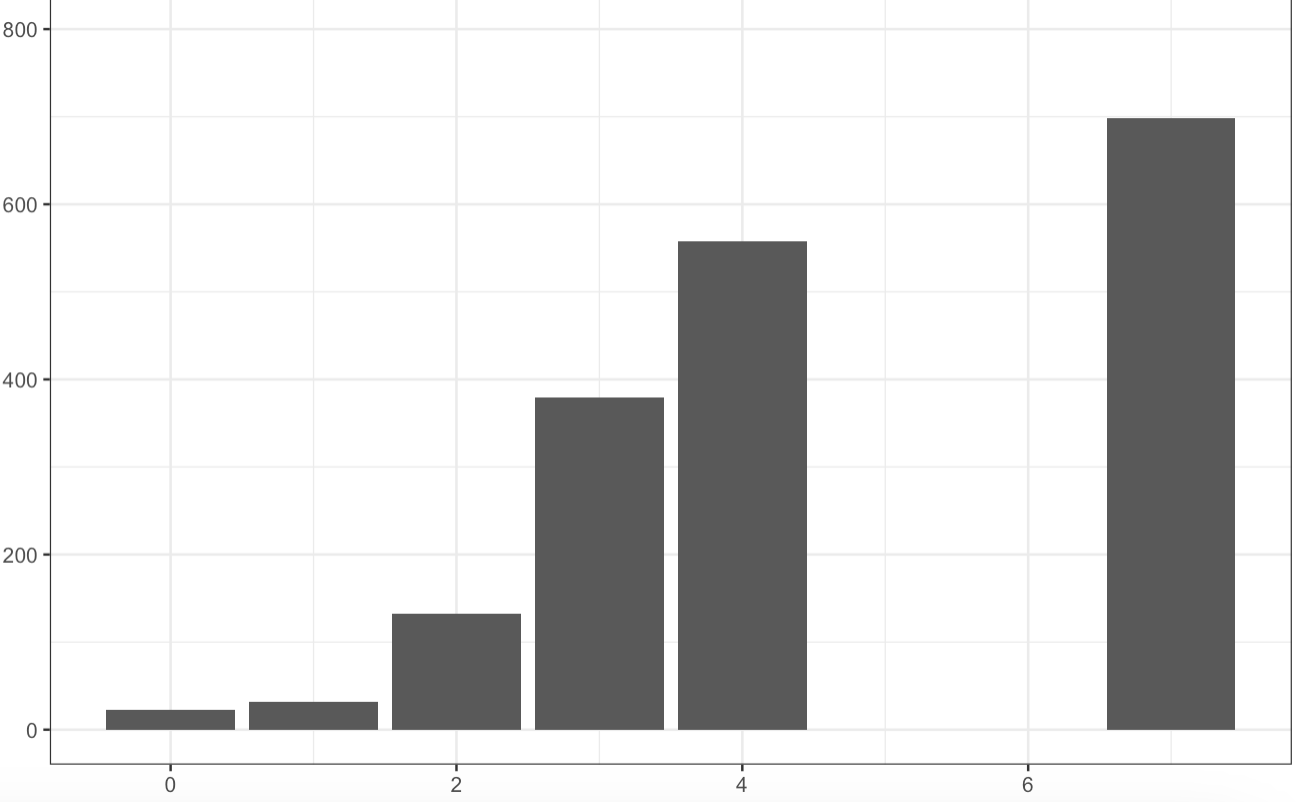
I have a simple dataframe that includes points where the x values are 0, 1, 2, 3, 4, and 7. When I go to plot the data this is what ggplot2 gives me:

enter image description here

I only want to include the points mentioned above. How do I take out the instance of 5 and 6 in the bar plot?

(I have tried googling the answer and nothing is coming up with my actual need so I figured I'd ask the community which might give an answer sooner - please be kind I know this is bound to have a simple solution)
$\endgroup$
1
  • 3
    $\begingroup$ I’m voting to close this question because it’s not a bioinformatics question and should be on stack overflow instead. $\endgroup$
    – user438383
    Commented Jun 12, 2023 at 23:47

1 Answer 1

4
$\begingroup$

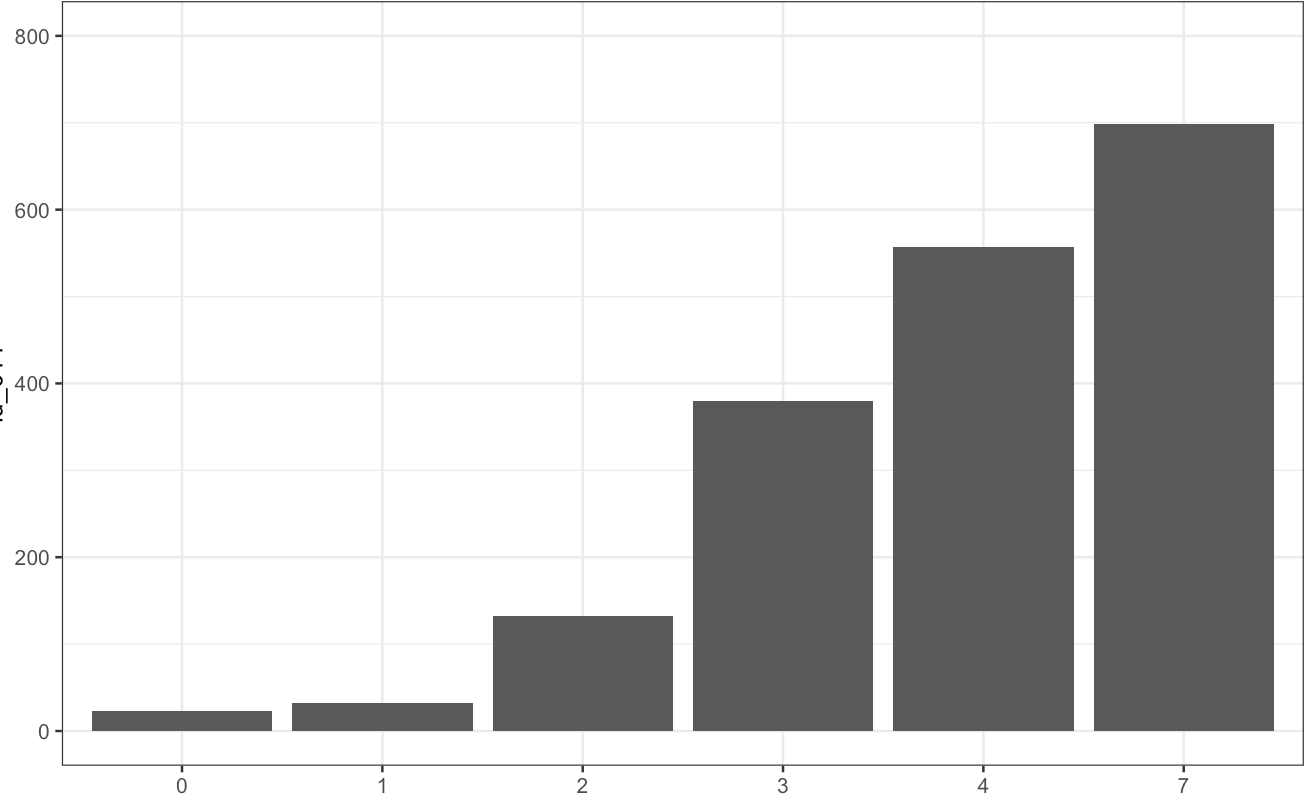
I was able to get it to work by converting the column in the dataframe to a character using this command:

df$day <- as.character(df$day)

and it worked like a charm! Thanks for your advice @haci

You can give a try by converting the column of numbers to a factor variable.

enter image description here

$\endgroup$

Your Answer

By clicking “Post Your Answer”, you agree to our terms of service and acknowledge you have read our privacy policy.

Not the answer you're looking for? Browse other questions tagged or ask your own question.