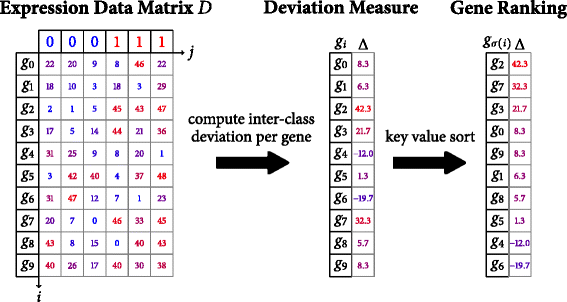
I wish to adapt the r language function fgseaL, https://github.com/ctlab/fgsea , to perform rapidGSEA, https://bmcbioinformatics.biomedcentral.com/articles/10.1186/s12859-016-1244-x , computation of inter-class deviation per gene and the subsequent gene rank sorting operation on 9 different phenotype labels as illustrated in the diagram immediately below:
I thought of applying the R-language rank() function on the Expression Data Matrix D. If that is not correct, what sequence of R language commands should we apply to the Expression Data Matrix D to calculate a key value sorted deviation measure across 8 labeled human leukemia groups and a healthy labeled normal control group prior to running fgseaL?
I show below how fgseaL finds the correlation matrix between the R language variable , mat, which corresponds to the Expression Data Matrix D and the R language variable , labels , which is a vector of gene phenotype labels
    tmatSc <- scale(t(mat))
    labelsSc <- scale(labels)[, 1]

    minSize <- max(minSize, 1)

    pathwaysFiltered <- lapply(pathways, function(p) { as.vector(na.omit(fmatch(p, rownames(mat)))) })
    pathwaysSizes <- sapply(pathwaysFiltered, length)

    toKeep <- which(minSize <= pathwaysSizes & pathwaysSizes <= maxSize)
    m <- length(toKeep)

    if (m == 0) {
        return(data.table(pathway=character(),
                          pval=numeric(),
                          padj=numeric(),
                          ES=numeric(),
                          NES=numeric(),
                          nMoreExtreme=numeric(),
                          size=integer(),
                          leadingEdge=list()))
    }

    pathwaysFiltered <- pathwaysFiltered[toKeep]
    pathwaysSizes <- pathwaysSizes[toKeep]

    corRanks <- var(tmatSc, labelsSc)[,1]
    ranksOrder <- order(corRanks, decreasing=T)
    ranksOrderInv <- invPerm(ranksOrder)
    stats <- corRanks[ranksOrder]

    pathwaysReordered <- lapply(pathwaysFiltered, function(x) ranksOrderInv[x])

    gseaStatRes <- do.call(rbind,
                           lapply(pathwaysReordered, calcGseaStat,
                                  stats=stats,
                                  returnLeadingEdge=TRUE))

I found a problem with the algorithm shown immediately below.
correcttest <- data.frame(names = row.names(normal))
correcttest <- cbind(correcttest3, normal)
correcttest <- cbind(correcttest3, ALL3m)
rownames(correcttest) <- correcttest$names
correcttest$names <- NULL
correctlabelnormal <- rep(0:0, 73)
correctlabelALL3m <- rep(1:1, 122)
correctlabel <- as.vector(c(correctlabelnormal,correctlabelALL3m))
s <- apply(correcttest, 1, function(x) coef(lm(x~correctlabel))[2])
o <- rank(s)
o <- max(o) - o + 1
res <- fgseaL(df,o,correctlabel,nperm = 2000,minSize = 1, maxSize=50000)
empty data table (0 rows) of 8 columns:   pathway,pval,padj,ES,NES,nMoreExtreme,size

I found the binary phenotype labeled group fgseaL test results below looked satisfactory.
correcttest <- data.frame(names = row.names(normal))
correcttest <- cbind(correcttest3, normal)
correcttest <- cbind(correcttest3, ALL3m)
rownames(correcttest) <- correcttest$names
correcttest$names <- NULL
correctlabelnormal <- rep(0:0, 73)
correctlabelALL3m <- rep(1:1, 122)
correctlabel <- as.vector(c(correctlabelnormal,correctlabelALL3m))
fgseaL(df,correcttest,correctlabel,nperm = 2000,minSize = 1, maxSize=50000)
       pathway        pval        padj         ES       NES nMoreExtreme  size
1: Gene.Symbol 0.003940887 0.003940887 -0.2460126 -1.180009            3 45714
                                 leadingEdge
1: AKIRIN2,LRRC20,HSPA5,HSPA5,DTWD2,ZFYVE28,
Thank you for your consideration.
