I am trying to compute Faith's pd for the first time using the picante package in R.
My code is the following:
library(picante)
library(tidyverse)

set.seed(19990409)

setwd("~/Desktop/Urbanization/Bacteria_QIIME2/Urb_Grad")


# loading a tsv list that has all OTUs as the first column, then all samples with the subsequent abundance of the OTU and taxonomy
#  data has been rarefied to match the sample with the fewest observed features

tab_samp_feat <- read_tsv("feature_and_taxonomy.txt",col_types = list(OTU_ID=col_character(),
                                                                     taxonomy=col_character(),
                                                                     .default=col_number()))

tab_samp_feat <- tab_samp_feat %>% select(-taxonomy) %>%
  rotate_df()
colnames(tab_samp_feat) <- tab_samp_feat[1,]
tab_samp_feat <- tab_samp_feat[-1,]


metadata <- read_tsv("Metadata.csv", col_types = cols(Samples = col_character(),
                                                                                      Sampling_season = col_character(),
                                                                                      Site = col_character(),
                                                                                      .default = col_number())) %>%
  select(c("Samples", "Sampling_season", "Site")) %>% as.matrix()
rownames(metadata) <- metadata[,1]
metadata <- metadata[,-1]

# rooted tree exported from QIIME2
phy <- read.tree("Exported/tree.nwk")


combined <- match.phylo.comm(phy, tab_samp_feat)

phy <- combined$phy
dat <- combined$comm
metadata <- metadata[match(rownames(dat), rownames(metadata)), ]
all.equal(rownames(dat), rownames(metadata))


dat.pd <- pd(dat, phy)
head(dat.pd)
boxplot(dat.pd$PD ~as.data.frame(metadata)$Site, xlab = "Site", ylab = "PD")
Everything seems to work alright, in the sense of all OTUs in my samples existing in the tree and the order of the metadata samples being the same as the order of the data. But the output is very strange: PD results:
The PD metric is very low, but I think that is a consequence of the very small SR number for most samples. However I believe that is wrong as for example, even when looking at the first sample M-N1 there are way more than two OTUs present. Screenshot of more than 2 features being present in the M-N1 sample
I was expecting the SR column to reflect the real presence/absence data of the features in my sample and for SR and PD to have more balanced values. I would be so grateful if anyone could help me realize what it is that I am doing wrong. Thank you!
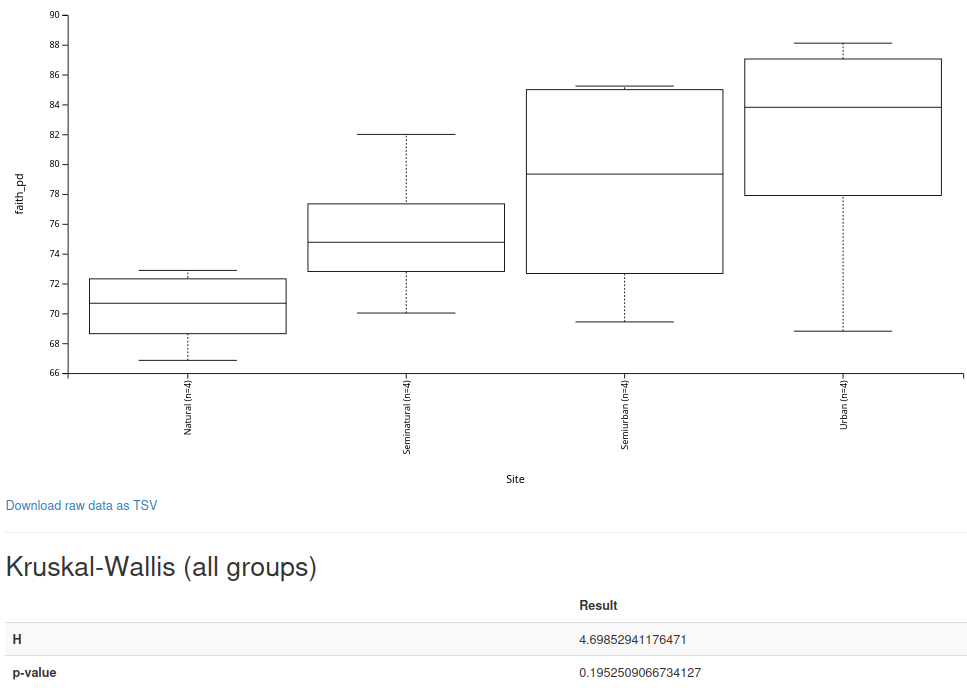
Update: I tried using QIIME2 to visualize the Faith pd metric and the results look like the following:
