5
$\begingroup$

I have data, obtained from a single metagenomic DNA sample, that consists of two MiSeq FASTQ files (R1 and R2) that I merged using PEAR.

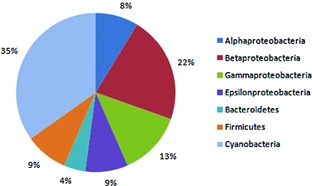
Now I want to estimate the abundances of the bacteria taxa to generate a figure like this one:

enter image description here

Figure from: Panosyan, Hovik, and Nils‐Kåre Birkeland. "Microbial diversity in an Armenian geothermal spring assessed by molecular and culture‐based methods." Journal of basic microbiology 54.11 (2014): 1240-1250.

The problem is that there wasn't a step of amplification of the 16S region as the goal of the sequencing was to discover new genes. I've already isolated 16S reads from my sample using SortMeRNA, but it seems like softwares that do OTU picking, taxonomic assignment and diversity analyses (such as mothur and QIIME) require that all the reads come from the same region of the 16S gene.

Is there a way of using these 16S reads that I've filtered using SortMeRNA in a diversity analysis using mothur/QIIME?
$\endgroup$
1
  • $\begingroup$ Cross-posted on biostars $\endgroup$
    – elsoja
    Commented Aug 22, 2017 at 20:24

2 Answers 2

1
$\begingroup$

New methods have been published in the time since this question was asked. Now, the relative abundance of organisms across different taxonomic levels can be estimated directly from metagenomic shotgun sequencing data without the need to identify and pull rRNA genes. Here are a few examples of popular tools:

  • Similar to the approach described in the question, mOTUs employs a database of single-copy phylogenetic marker genes to create taxonomic profiles from short-read metagenomic data.
  • Kraken associates short genomic substrings (k-mers) with the lowest common ancestor in its database. The output can then be processed with Bracken to get estimates of relative abundance at any taxonomic level, and the Bracken output table can then be passed to a tool like bracken_plot to visualize differences in relative abundance between samples.
  • Like mOTUs, MetaPhlAn uses a large marker gene database to assign reads to bacterial, archaeal, viral, and eukaryotic clades. This allows for relative abundance estimation in terms of number of cells. If their paper is to be believed, MetaPhlAn3 outperforms both mOTUs2 and Kraken2/Bracken in terms of abundance profile accuracy.

In addition to more accurate species detection, MetaPhlAn3 also quantified taxonomic abundance profiles more accurately compared to MetaPhlAn 2, mOTUs2, and Bracken based on Bray-Curtis similarity in most datasets ... While it was slightly outperformed by mOTUs2 (only in high-recall mode) on the synthetic mouse gut dataset, even in this case, correlation-based measures (Pearson Correlation Coefficient between estimated and expected relative abundances) found MetaPhlAn3 to be more accurate (r = 0.73) than the other considered profilers (MetaPhlAn2 r = 0.63, mOTUs2 precision r = 0.60, mOTUs2 recall r = 0.71, Bracken r = 0.43).

Although it is now dated, How to Choose Your Metagenomics Classification Tool from the Salzberg lab lists more options and links the associated publications, including Centrifuge and Pavian, the latter of which is geared specifically toward visualization of metagenomic classification data.

$\endgroup$
1
  • 1
    $\begingroup$ Its a thorough answer. Machine learning has enabled classification of bacteria, presumably on 16S. I'm aware of early papers in bioinformatics. $\endgroup$
    – M__
    Commented Feb 8, 2022 at 20:44
0
$\begingroup$

This is maybe a very simplified approach but have you thought about simply blasting them against the rRNA/ITS database of NCBI/ SILVA with ie. diamond?

First download the database files from either of the database:

SILVA: https://www.arb-silva.de/no_cache/download/archive/current/Exports/ NCBI: https://ftp.ncbi.nlm.nih.gov/blast/db/

Second: Use DIAMOND to align fastas of interest (in your case these will be the 16S rRNA Sequences. These will give you hits per fasta which you can save into tsv or csv format and parse in excel.

To get the abundances, take your fastas of interest and align them back to your raw files (paired reads). You can use BOWTIE + SAMTOOLs for this.

Concatenate the results from the DIAMOND output with the abundances and voila, you should get a nice table with taxa and their abundances. If you have more samples and you would like to compare them, ie. compare the taxa composition. I would strongly suggest that you do some further normalisation ie. normalise the abundances with sequencing depths.

Maybe it's a long way around it but in theory, it should do the job.

$\endgroup$

Your Answer

By clicking “Post Your Answer”, you agree to our terms of service and acknowledge you have read our privacy policy.

Not the answer you're looking for? Browse other questions tagged or ask your own question.