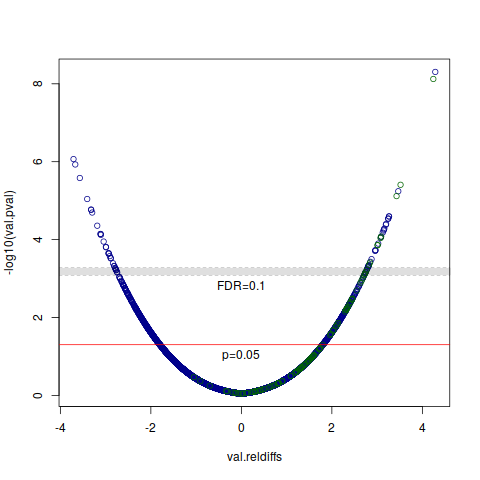
I have a set of differentially methylated/expressed/whatever entities with p-values attached (example below).
entity_name    p-value    magnitude
entity1        0.04459    0.68
entity2        0.02283    0.99
...
entity_n       0.78       0.025
Typically, I apply the p.adjust function in R with the "fdr" (Benjamini-Hochberg) approach to leave me with p-values adjusted to control the FDR.
adjusted <- p.adjust(mydata,"fdr")
However, I am interested in showing a volcano plot with the unadjusted p-values, and two alpha levels: 0.05 and one that corresponds to the correction. What is the best way to get this alpha? Is it appropriate to set the "corrected alpha" to the lowest original p-value that doesn't pass FDR correction?
