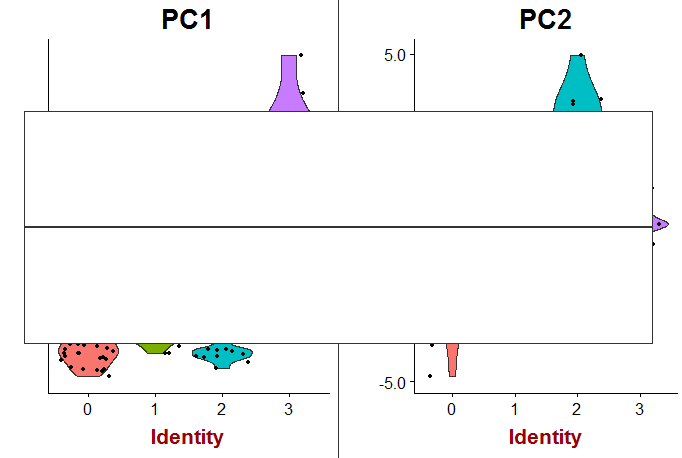
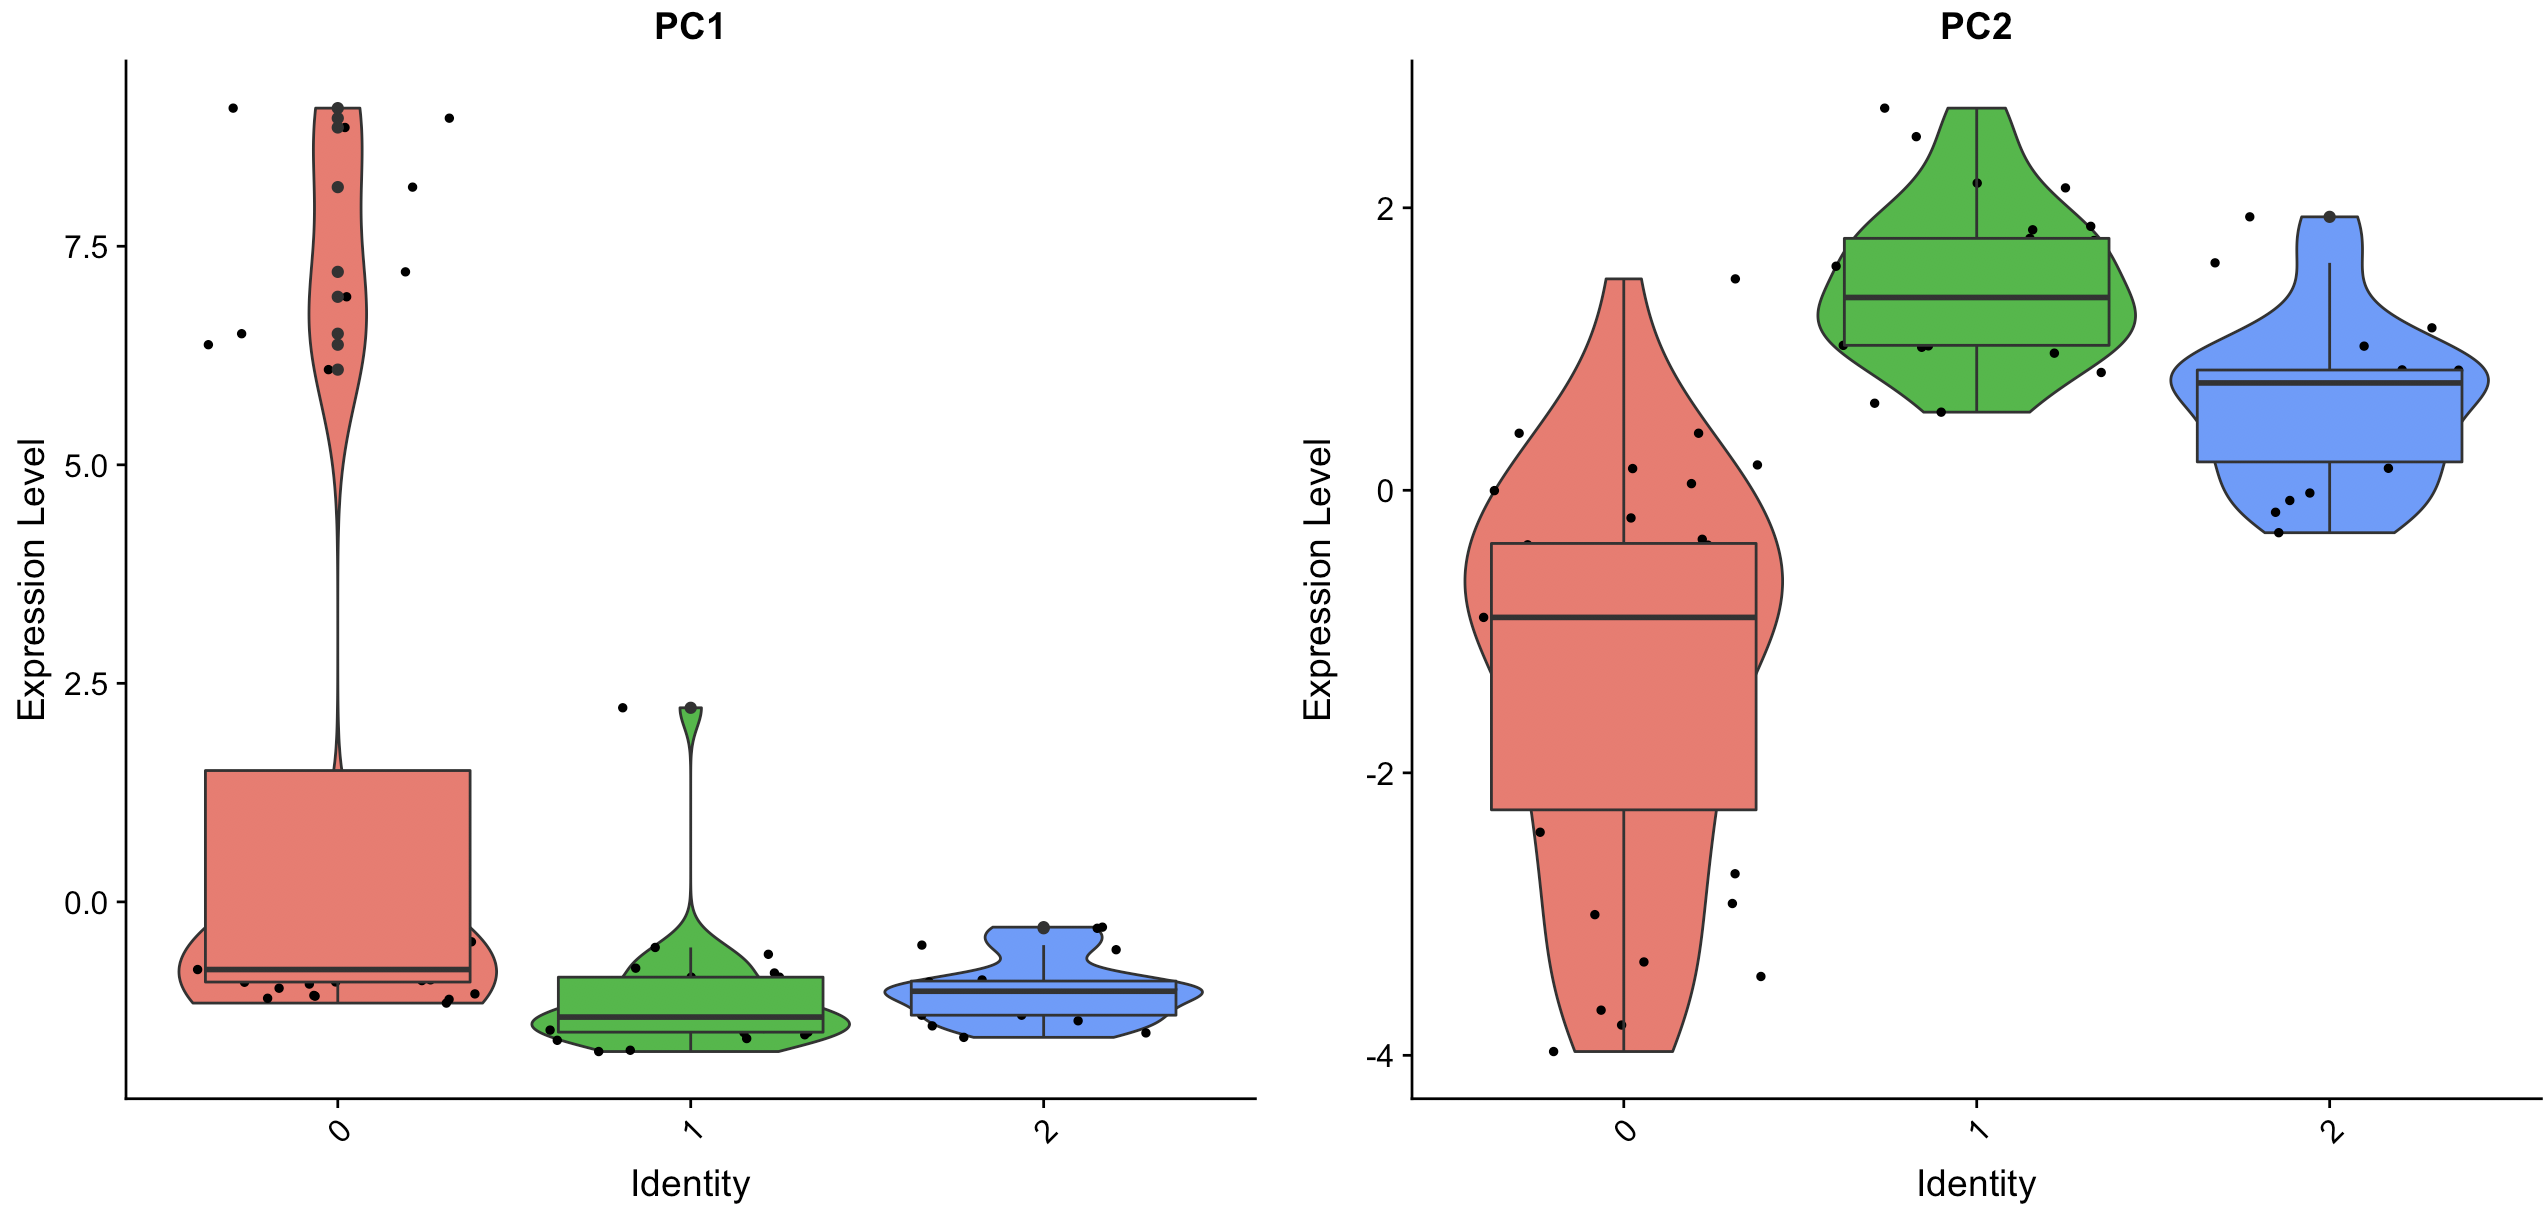
I am using the following function from seurat package to generate multiple violon plots and I am interested in adding box plots to them but it doesn't work when I have plotted different data at once. Is there a way to solve it ?
For example, this works:
library(Seurat)
VlnPlot(object = pbmc_small, features.plot = 'PC1') +
  geom_boxplot()
But this will simply lead into an empty box on top of my plots:
VlnPlot(object = pbmc_small, features.plot = c('PC1', 'PC2')) +
  geom_boxplot()


