7
$\begingroup$

I am running some analysis on an RNA-seq dataset. I have a list of transcripts that are potential lncRNA for which I ran both Kallisto and Salmon aligners. The input data for index building and quantification includes mRNA as well as these potential lncRNA.

Commands for one replicate:

Salmon

salmon index --keepDuplicates -t transcripts.fasta -i index_directory/ -k 31
salmon quant --seqBias --gcBias -i index_directory/ --libType ISR --auxDir index_directory/ -1 sample_R1.fastq.gz -2 sample_R2.fastq.gz -o output_name

Kallisto

kallisto index -i kallisto_index.idx transcripts.fasta
kallisto quant -i kallisto_index.idx -o output_name --rf-stranded sample_R1.fastq.gz sample_R2.fastq.gz

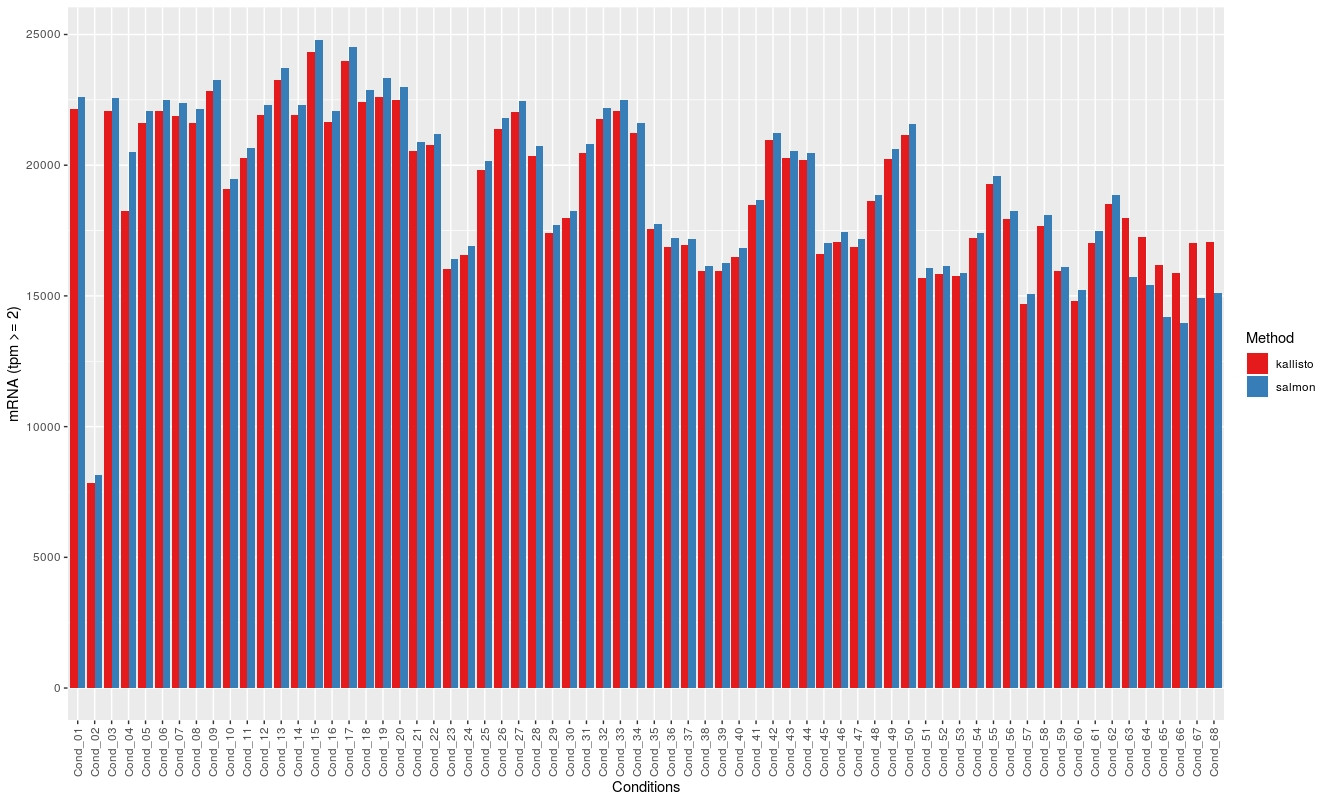
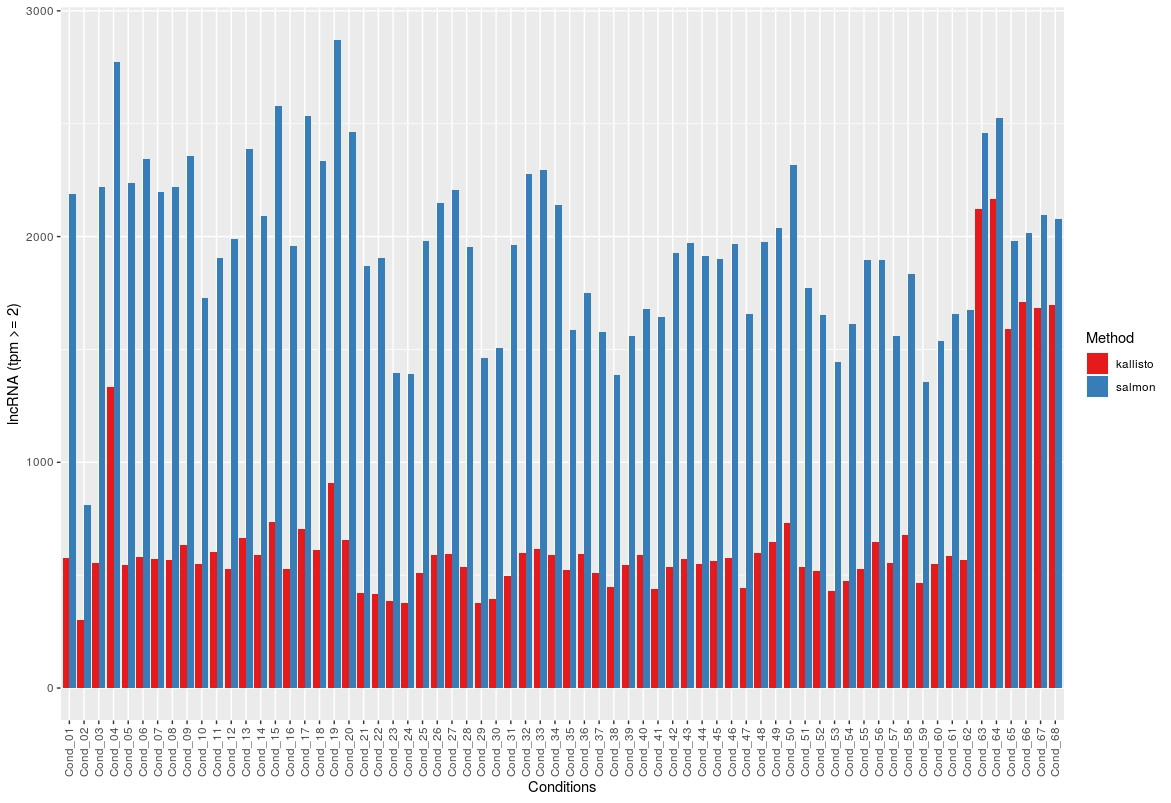
Then I used the tpm values, averaged replicates (3) and plotted the number of transcripts per condition that had a tpm > 2. Same result for tpm > 5.

The following graph shows the for mRNA:

enter image description here

And for lncRNA:

enter image description here

Again, the analysis were done with both lncRNA and mRNA transcripts together in the same fasta file.

The overlap is not shown here but is always smaller than the count for Kallisto, for the lncRNA.

In literature both tools seem to have similar results. I cannot find a reason for this. If there would be an error somewhere I would expect to see also differences in the conding RNAs which does not happen.
$\endgroup$
4
  • 1
    $\begingroup$ While the question seems great I doubt we can provide an answer without knowing the data. Could you reproduce this in a public dataset? (I think you won't be able to share the (processed) data isn't it?) But perhaps the errors lies somewhere in the code used to create the plots (rare, but it could happen)... $\endgroup$
    – llrs
    Commented Apr 25, 2019 at 14:33
  • $\begingroup$ It is true, I am not able to share details on the data. However I can try to reproduce the results with a public dataset. Not just to edit the question, but it can actually give some clues on what is happening in case of a code error or due to the type of data. Thank you for the remark. I wanted to see if anyone had come across this problem since it is not the main focus of my project so I am not sure when I can adress this $\endgroup$ Commented Apr 25, 2019 at 15:44
  • 1
    $\begingroup$ I think a scatter plot of the abundance estimates from each method might be a more informative comparison. That is, for each lncRNA, plot kallisto's estimate vs Salmon's. Are the kallisto estimates systematically lower or are they non-existent? $\endgroup$
    – merv
    Commented Apr 25, 2019 at 23:19
  • 1
    $\begingroup$ Shh, don’t tell Lior Pachter. $\endgroup$ Commented Apr 29, 2019 at 17:09

1 Answer 1

2
$\begingroup$

There has been a detailed comparison of kallisto and salmon for lncRNA transcripts by Zheng et al https://www.biorxiv.org/content/biorxiv/early/2018/01/09/241869.full.pdf

It shows them to be near identical. This suggests there is some problem with the way you made the comparison/plot.

$\endgroup$
1
  • 2
    $\begingroup$ I have had similar results to the preprint when I did some comparisons between the two methods. $\endgroup$
    – GWW
    Commented May 15, 2019 at 13:40

Your Answer

By clicking “Post Your Answer”, you agree to our terms of service and acknowledge you have read our privacy policy.

Not the answer you're looking for? Browse other questions tagged or ask your own question.