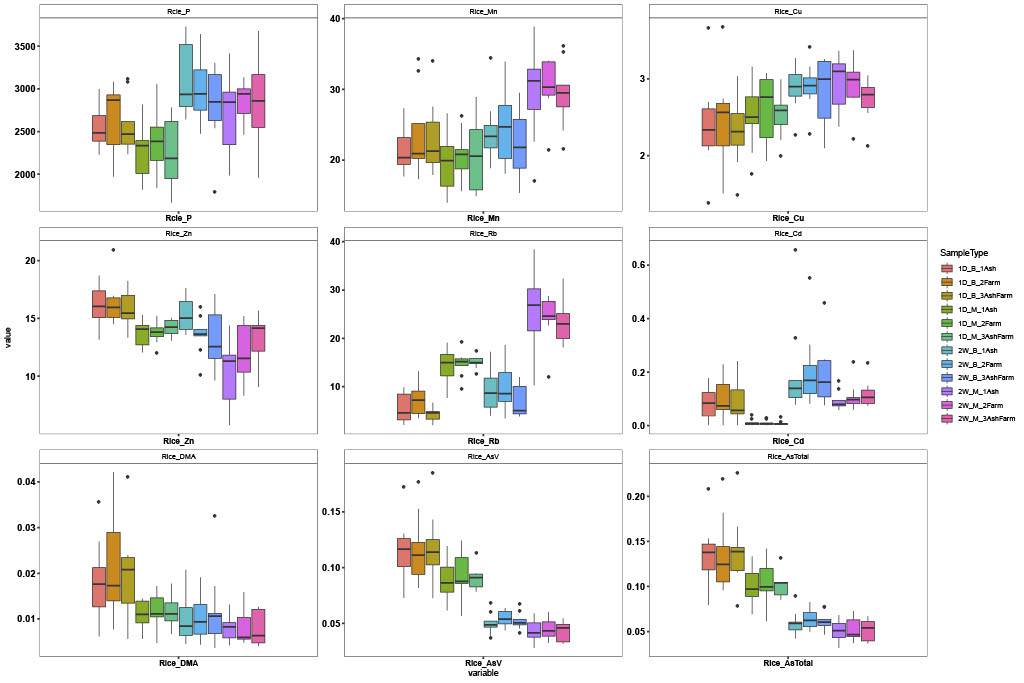
I am using below code to plot multiple box plot but I am getting the variable name on top as well as at the bottom for each variable, How I can put the variable name on the top of each box plot like Rice_P at top and I also want to add (mg/kg) with the variable name at the top so it should look like Rice_p (mg/Kg) and further how I can do ANOVA and posthoc test to find the significant difference between groups.
library(reshape2)
library(ggplot2)
list.files()
morphData <- read.table("Box.plot.chemical.txt", sep="\t", header=TRUE)
morphData


     SampleType   Rcie_P  Rice_Mn  Rice_Cu   Rice_Zn   Rice_Rb     Rice_Cd
1       1D_M_1Ash 2814.689 23.72055 2.766135 14.458523 14.547134 0.041588921
2      1D_M_2Farm 1838.551 18.75750 2.439463 12.956492  9.603595 0.030881586
3   1D_M_3AshFarm 2184.207 20.54325 2.595371 13.068580 12.717532 0.032639435
4       1D_M_1Ash 2761.324 26.59382 2.468078 14.062242 17.952447 0.003499666
5      1D_M_2Farm 2550.337 26.23494 2.761177 14.170396 15.193950 0.005672558


df.m <- melt(morphData, id.var = "SampleType")
pdf("box.plot.pdf", width = 18, height = 12)


p <- ggplot(data = df.m, aes(x=variable, y=value)) +
theme_bw() +
theme(
      panel.grid.major=element_blank(),
      panel.grid.minor=element_blank(),
      plot.title = element_text(vjust = -8.5,hjust = 0.1),
      line=element_line(size=1),
      axis.text = element_text(size = 20, face ="bold"),
      axis.text.x = element_text(size = 10, face ="bold", hjust = 0.5, colour = "black"),
      axis.text.y = element_text(size = 12, face ="bold", hjust = 0.5, colour = "black")) +


theme(strip.background=element_rect(fill="white")) +
theme(strip.text=element_text(color="black")) +
geom_boxplot(aes(fill=SampleType))

p + facet_wrap( ~variable, scales="free")
dev.off();
