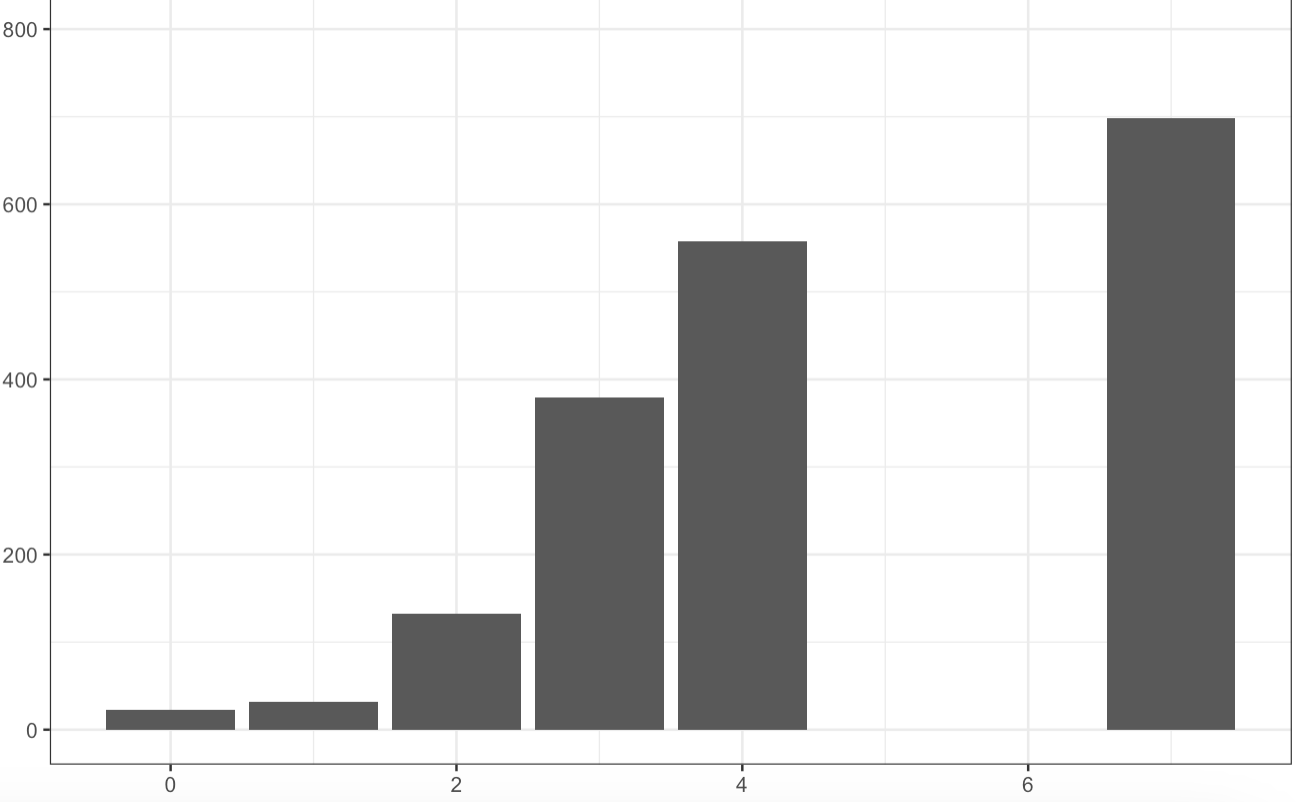
I have a simple dataframe that includes points where the x values are 0, 1, 2, 3, 4, and 7. When I go to plot the data this is what ggplot2 gives me:
I only want to include the points mentioned above. How do I take out the instance of 5 and 6 in the bar plot?
(I have tried googling the answer and nothing is coming up with my actual need so I figured I'd ask the community which might give an answer sooner - please be kind I know this is bound to have a simple solution)
