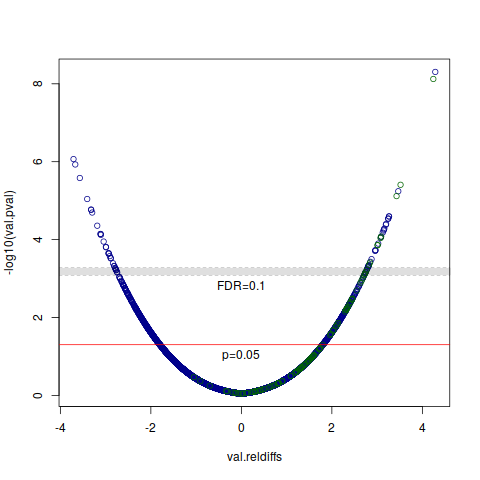
When you're doing a p-value adjustment, the same unadjusted p-value in different genes can be given different adjusted p-values depending on other factors. That means that you can't directly draw a line associated with the FDR on a plot of unadjusted p-value.
One possibility would be to take a range of values that are close to the FDR threshold (e.g. the 20 values closest to threshold), and draw a p-value greyzone within that region:
#!/usr/bin/Rscript
values <- c(rnorm(10000),rnorm(100, mean=1.5));
val.mean <- median(values);
val.diffs <- abs(values - median(values));
val.reldiffs <- (values - median(values));

val.pval <- pnorm(val.diffs, mean = mean(val.diffs),
                   sd=sd(val.diffs), lower.tail=FALSE);
val.padj <- p.adjust(val.pvals, method="BH");
fdr.threshold <- 0.1;
close.bh <- order(abs(val.padj - fdr.threshold))[1:20];

png("SE.663.png");
plot(val.reldiffs, -log10(val.pval),
     col=ifelse(1:10100 <= 10000,"darkblue","darkgreen"));
abline(h=-log10(0.05), col="red");
text(0,-log10(0.05),"p=0.05", pos=1);
abline(h=range(-log10(val.pval[close.bh])), col="#00000040", lty="dashed");
rect(xleft=min(val.reldiffs)*2, xright=max(val.reldiffs)*2,
     ytop=max(-log10(val.pval[close.bh])),
     ybottom=min(-log10(val.pval[close.bh])), col="#00000020", border=NA);
text(0,min(-log10(val.pval[close.bh])),"FDR=0.1", pos=1);
invisible(dev.off());
