added 56 characters in body
Source Link

I am performing a GWAS analysis and try to understand the influence of the minor allele count filter.Setting the filter to 1 % gave me this plot and I am confused about the same -log10 pvalues around ~ 3.8 which shows a strange pattern (many dots in one line with same value).

enter image description here

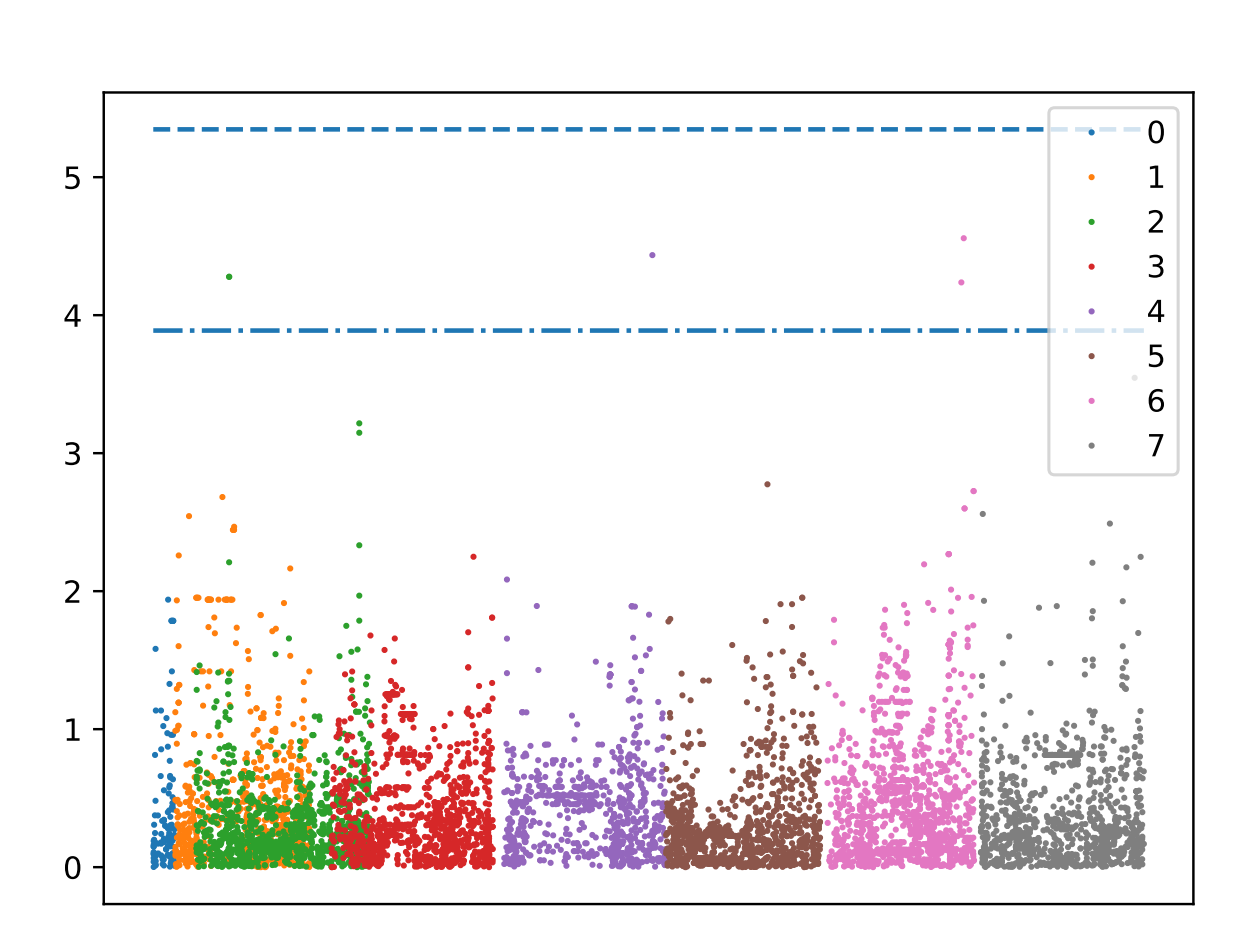
If I increase the filter to 6 % the dots in a line disappear but I loose also some significant SNPs:

enter image description here

Sample are about 77000 SNP positions (barley), unimputed from GWAS (all NaNs removed). GWAS was performed with 200 phenotype samples.

How to interpret the dots in a line?
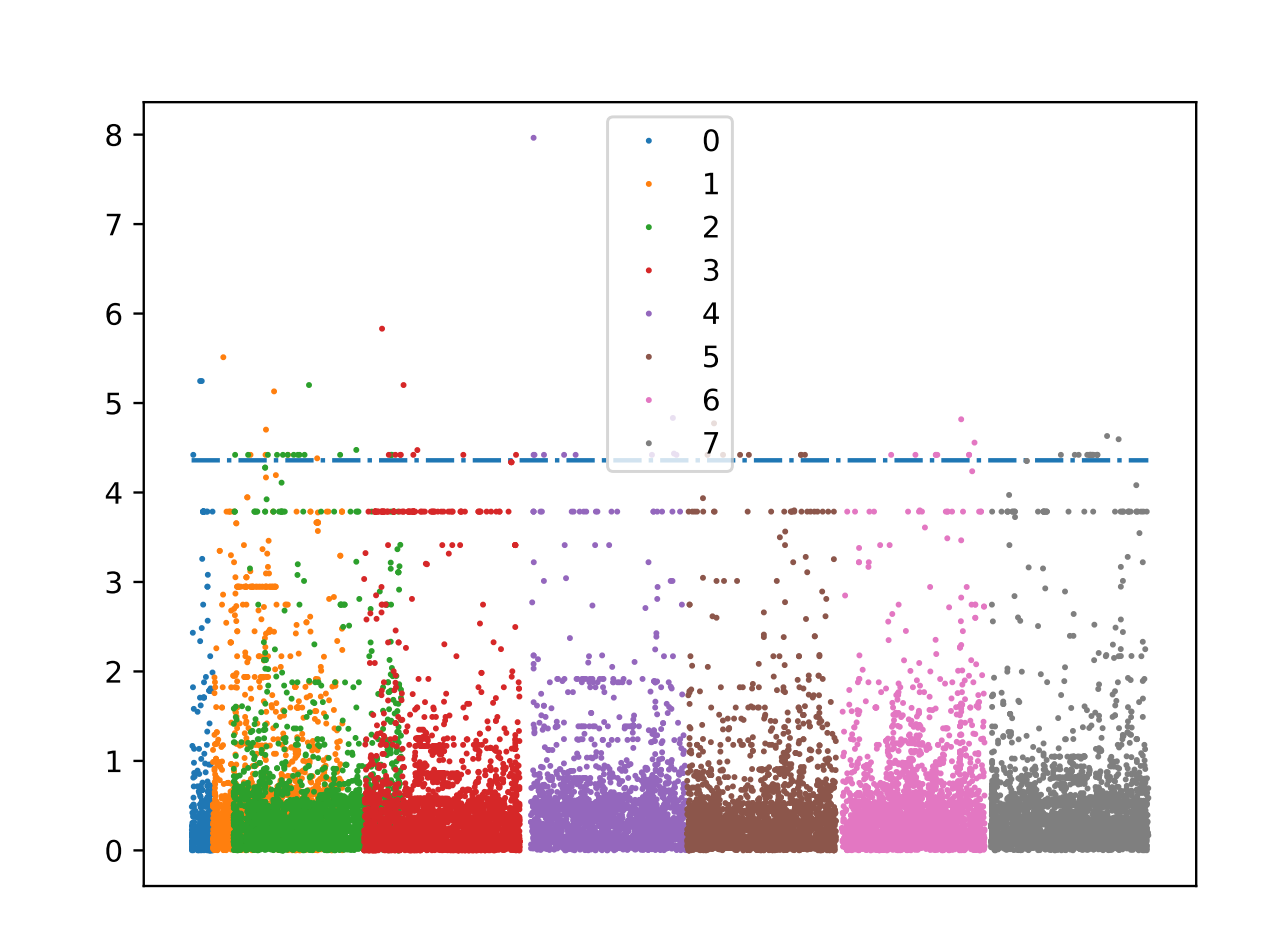
I am performing a GWAS analysis and try to understand the influence of the minor allele count filter.Setting the filter to 1 % gave me this plot and I am confused about the same -log10 pvalues around ~ 3.8 which shows a strange pattern (many dots in one line with same value).

enter image description here

If I increase the filter to 6 % the dots in a line disappear but I loose also some significant SNPs:

enter image description here

Sample are about 77000 SNP positions, unimputed from GWAS (all NaNs removed).

How to interpret the dots in a line?

I am performing a GWAS analysis and try to understand the influence of the minor allele count filter.Setting the filter to 1 % gave me this plot and I am confused about the same -log10 pvalues around ~ 3.8 which shows a strange pattern (many dots in one line with same value).

enter image description here

If I increase the filter to 6 % the dots in a line disappear but I loose also some significant SNPs:

enter image description here

Sample are about 77000 SNP positions (barley), unimputed from GWAS (all NaNs removed). GWAS was performed with 200 phenotype samples.

How to interpret the dots in a line?
added 41 characters in body
Source Link

I am performing a GWAS analysis and try to understand the influence of the minor allele count filter.Setting the filter to 1 % gave me this plot and I am confused about the same -log10 pvalues around ~ 3.8 which shows a strange pattern (many dots in one line with same value).

enter image description here

If I increase the filter to 6 % the dots in a line disappear but I loose also some significant SNPs:

enter image description here

Sample are about 77000 SNP positions, unimputed from GWAS (all NaNs removed).

How to interpret the dots in a line?

I am performing a GWAS analysis and try to understand the influence of the minor allele count filter.Setting the filter to 1 % gave me this plot and I am confused about the same -log10 pvalues around ~ 3.8 which shows a strange pattern (many dots in one line with same value).

enter image description here

If I increase the filter to 6 % the dots in a line disappear but I loose also some significant SNPs:

enter image description here

Sample are about 77000 SNP positions, unimputed from GWAS (all NaNs removed).

How to interpret the dots in a line?

Source Link

GWAS MAC filter Interpretation

I am performing a GWAS analysis and try to understand the influence of the minor allele count filter.Setting the filter to 1 % gave me this plot and I am confused about the same -log10 pvalues around ~ 3.8 which shows a strange pattern (many dots in one line with same value).

enter image description here

If I increase the filter to 6 % the dots in a line disappear but I loose also some significant SNPs:

enter image description here