Added some code and dummy data
Source Link
Ram RS
  • 2.5k
  • 11
  • 29

Dummy data and code:

devtools::install_github('jokergoo/ComplexHeatmap');
library(ComplexHeatmap);
library(viridis);

dummy_top_mat <- structure(c(0.4563, 0.2211, 1.2235, 0.067, 1.6859, 1.0936, 0.4533, 
1.6844, 1.0039, 0.5402, 0.6841, 1.498, 1.042, 0.1711, 0.3565, 
2.2814, 3.0516, 1.5012, 0.5367, 3.0846, 1.1909, 0.235, 1.4266, 
0.4858, 2.9054, 0.3733, 0.6902, 0.8555, 0.4234, 2.6778, 0.1568, 
0.5556, 2.0172, 0.8034, 2.2897, 0.1166, 3.8033, 0.1431, 2.0606, 
1.2725, 1.5365, 0.4123, 1.2087, 1.1264, 0.8334, 1.1943, 1.58, 
1.5849, 0.3004, 0.3722, 0.0362, 0.0532, 1.4867, 0.4053, 0.3615, 
0.0897, 1.3217, 1.1447, 1.3058, 0.1903, 0.1067, 0.9482, 1.3382, 
3.2955, 0.391, 1.0418, 0.2041, 1.208, 1.5857, 3.5313, 0.472, 
1.389, 0.2143, 0.0226, 0.029, 0.444, 2.0521, 0.3955, 0.3495, 
0.5062, 1.3236, 1.3234, 0.7111, 0.1176, 2.2223, 1.2073, 0.3964, 
2.1175, 0.3382, 0.2816, 0.71, 3.1417, 0.2402, 0.5793, 0.7662, 
1.6782, 0.0986, 0.087, 0.5447, 2.6672, 1.2498, 1.0676, 1.8608, 
1.8146, 0.1422, 0.4221, 0.0303, 0.9541, 0.7358, 1.7664, 1.5144, 
0.2034, 0.9366, 0.7837, 0.3284, 0.1477, 1.8306, 1.3564, 0.1126, 
0.0171, 2.9858, 0.0233, 0.2796, 0.6995, 1.6081, 0.215, 1.7093, 
0.5178, 1.7061, 2.473, 1.8912, 0.7661, 4.4102, 1.2963, 0.6542, 
0.4281, 0.4491, 0.6, 0.4076, 1.6869, 0.4747, 3.9823, 1.1226, 
2.7355, 2.7036, 0.2241, 0.983, 1.0992, 1.4736, 0.1584, 0.2995, 
0.2272, 0.5744, 0.9314, 0.6924, 0.0812, 1.361, 0.727, 0.1525, 
1.3367, 0.566, 2.7801, 0.2349, 3.2655, 1.0675, 0.449, 0.5411, 
0.8291, 0.52, 0.0507, 0.6538, 0.4636, 1.2063, 0.9784, 0.1925, 
0.0756, 0.136, 1.2529, 0.317, 0.0281, 0.8668, 3.4138, 5.3898, 
0.521, 0.087, 3.4819, 0.1114, 0.0061, 0.9804, 1.139, 1.4159, 
1.0297, 0.6503, 1.0828, 2.3527, 0.057, 0.5602, 0.4017, 0.9985, 
0.8673), .Dim = c(10L, 20L), .Dimnames = list(c("gene01", "gene02", 
"gene03", "gene04", "gene05", "gene06", "gene07", "gene08", "gene09", 
"gene10"), c("sample01", "sample02", "sample03", "sample04", 
"sample05", "sample06", "sample07", "sample08", "sample09", "sample10", 
"sample11", "sample12", "sample13", "sample14", "sample15", "sample16", 
"sample17", "sample18", "sample19", "sample20")));

dummy_bottom_mat <- structure(c("Positive", "Positive", "Positive", "Positive", "Negative", 
"Positive", "Positive", "Positive", "Positive", "Negative", "Positive", 
"Negative", "Positive", "Positive", "Positive", "Positive", "Positive", 
"Positive", "Positive", "Positive", "Positive", "Positive", "Positive", 
"Negative", "Positive", "Positive", "Positive", "Positive", "Positive", 
"Negative", "Positive", "Positive", "Positive", "Negative", "Positive", 
"Positive", "Positive", "Positive", "Positive", "Positive", "Positive", 
"Positive", "Positive", "Positive", "Positive", "Positive", "Negative", 
"Positive", "Positive", "Positive", "Positive", "Positive", "Positive", 
"Positive", "Negative", "Positive", "Positive", "Positive", "Positive", 
"Positive", "Positive", "Positive", "Positive", "Positive", "Positive", 
"Positive"), .Dim = c(6L, 20L), .Dimnames = list(c("marker1", 
"marker2", "marker3", "marker4", "marker5", "marker6"), c("sample01", 
"sample02", "sample03", "sample04", "sample05", "sample06", "sample07", 
"sample08", "sample09", "sample10", "sample11", "sample12", "sample13", 
"sample14", "sample15", "sample16", "sample17", "sample18", "sample19", 
"sample20")));

hmap1 <- Heatmap(dummy_top_mat, col = colorRampPalette(viridis(15))(100), name = 'log2 (TPM)', na_col = 'grey60', cluster_rows = FALSE, cluster_columns = FALSE, row_names_side = 'left', column_title_side = 'top', rect_gp = gpar(col='white', lwd=0.5), height=unit(10*0.75,'cm'), width = unit(20*0.75, 'cm'), column_title = 'Gene Expression');

hmap2 <- Heatmap(dummy_bottom_mat, col = c('Negative'='red', 'Positive'='blue'), na_col = 'grey60', row_split = factor( c('gp1','gp1','gp1','gp1','gp2','gp2'), c('gp1','gp2'), ordered = TRUE), name = 'Marker\nStatus', rect_gp = gpar(col='white',lwd=1), row_title = NULL, height = unit(6*0.75,'cm'), width = unit(20*0.75, 'cm'), row_names_side = 'left', column_title = 'Biomarkers');

draw(hmap1 %v% hmap2, ht_gap = unit(1, 'cm'), auto_adjust = FALSE);

sessionInfo()

R version 3.5.1 (2018-07-02)
Platform: x86_64-apple-darwin13.4.0 (64-bit)
Running under: macOS  10.14.4

Matrix products: default
BLAS: /System/Library/Frameworks/Accelerate.framework/Versions/A/Frameworks/vecLib.framework/Versions/A/libBLAS.dylib
LAPACK: /Users/ram/miniconda3/lib/R/lib/libRblas.dylib

locale:
[1] en_US.UTF-8/en_US.UTF-8/en_US.UTF-8/C/en_US.UTF-8/en_US.UTF-8

attached base packages:
[1] grid      stats     graphics  grDevices utils     datasets  methods   base     

other attached packages:
 [1] viridis_0.5.1        viridisLite_0.3.0    ComplexHeatmap_2.1.0 forcats_0.4.0       
 [5] stringr_1.4.0        dplyr_0.8.0.1        purrr_0.2.5          readr_1.3.1         
 [9] tidyr_0.8.3          tibble_2.1.1         ggplot2_3.1.1        tidyverse_1.2.1     

loaded via a namespace (and not attached):
 [1] Rcpp_1.0.0          lubridate_1.7.4     lattice_0.20-38     circlize_0.4.6      prettyunits_1.0.2  
 [6] png_0.1-7           ps_1.3.0            rprojroot_1.3-2     assertthat_0.2.1    digest_0.6.18      
[11] R6_2.3.0            cellranger_1.1.0    plyr_1.8.4          backports_1.1.4     reprex_0.2.1       
[16] httr_1.4.0          pillar_1.3.1        GlobalOptions_0.1.0 rlang_0.3.1         lazyeval_0.2.2     
[21] readxl_1.3.1        rstudioapi_0.10     callr_3.2.0         GetoptLong_0.1.7    desc_1.2.0         
[26] devtools_2.0.2      munsell_0.5.0       broom_0.5.2         compiler_3.5.1      modelr_0.1.4       
[31] pkgconfig_2.0.2     pkgbuild_1.0.3      shape_1.4.4         tidyselect_0.2.5    gridExtra_2.3      
[36] crayon_1.3.4        withr_2.1.2         nlme_3.1-137        jsonlite_1.6        gtable_0.3.0       
[41] magrittr_1.5        scales_1.0.0        cli_1.1.0           stringi_1.4.3       remotes_2.0.4      
[46] fs_1.3.1            xml2_1.2.0          generics_0.0.2      rjson_0.2.20        RColorBrewer_1.1-2 
[51] tools_3.5.1         glue_1.3.0          hms_0.4.2           processx_3.3.1      pkgload_1.0.2      
[56] parallel_3.5.1      clue_0.3-57         colorspace_1.4-1    cluster_2.0.7-1     sessioninfo_1.1.1  
[61] rvest_0.3.3         memoise_1.1.0       haven_2.1.0         usethis_1.5.0 
Added note on cross-post
Source Link
Ram RS
  • 2.5k
  • 11
  • 29

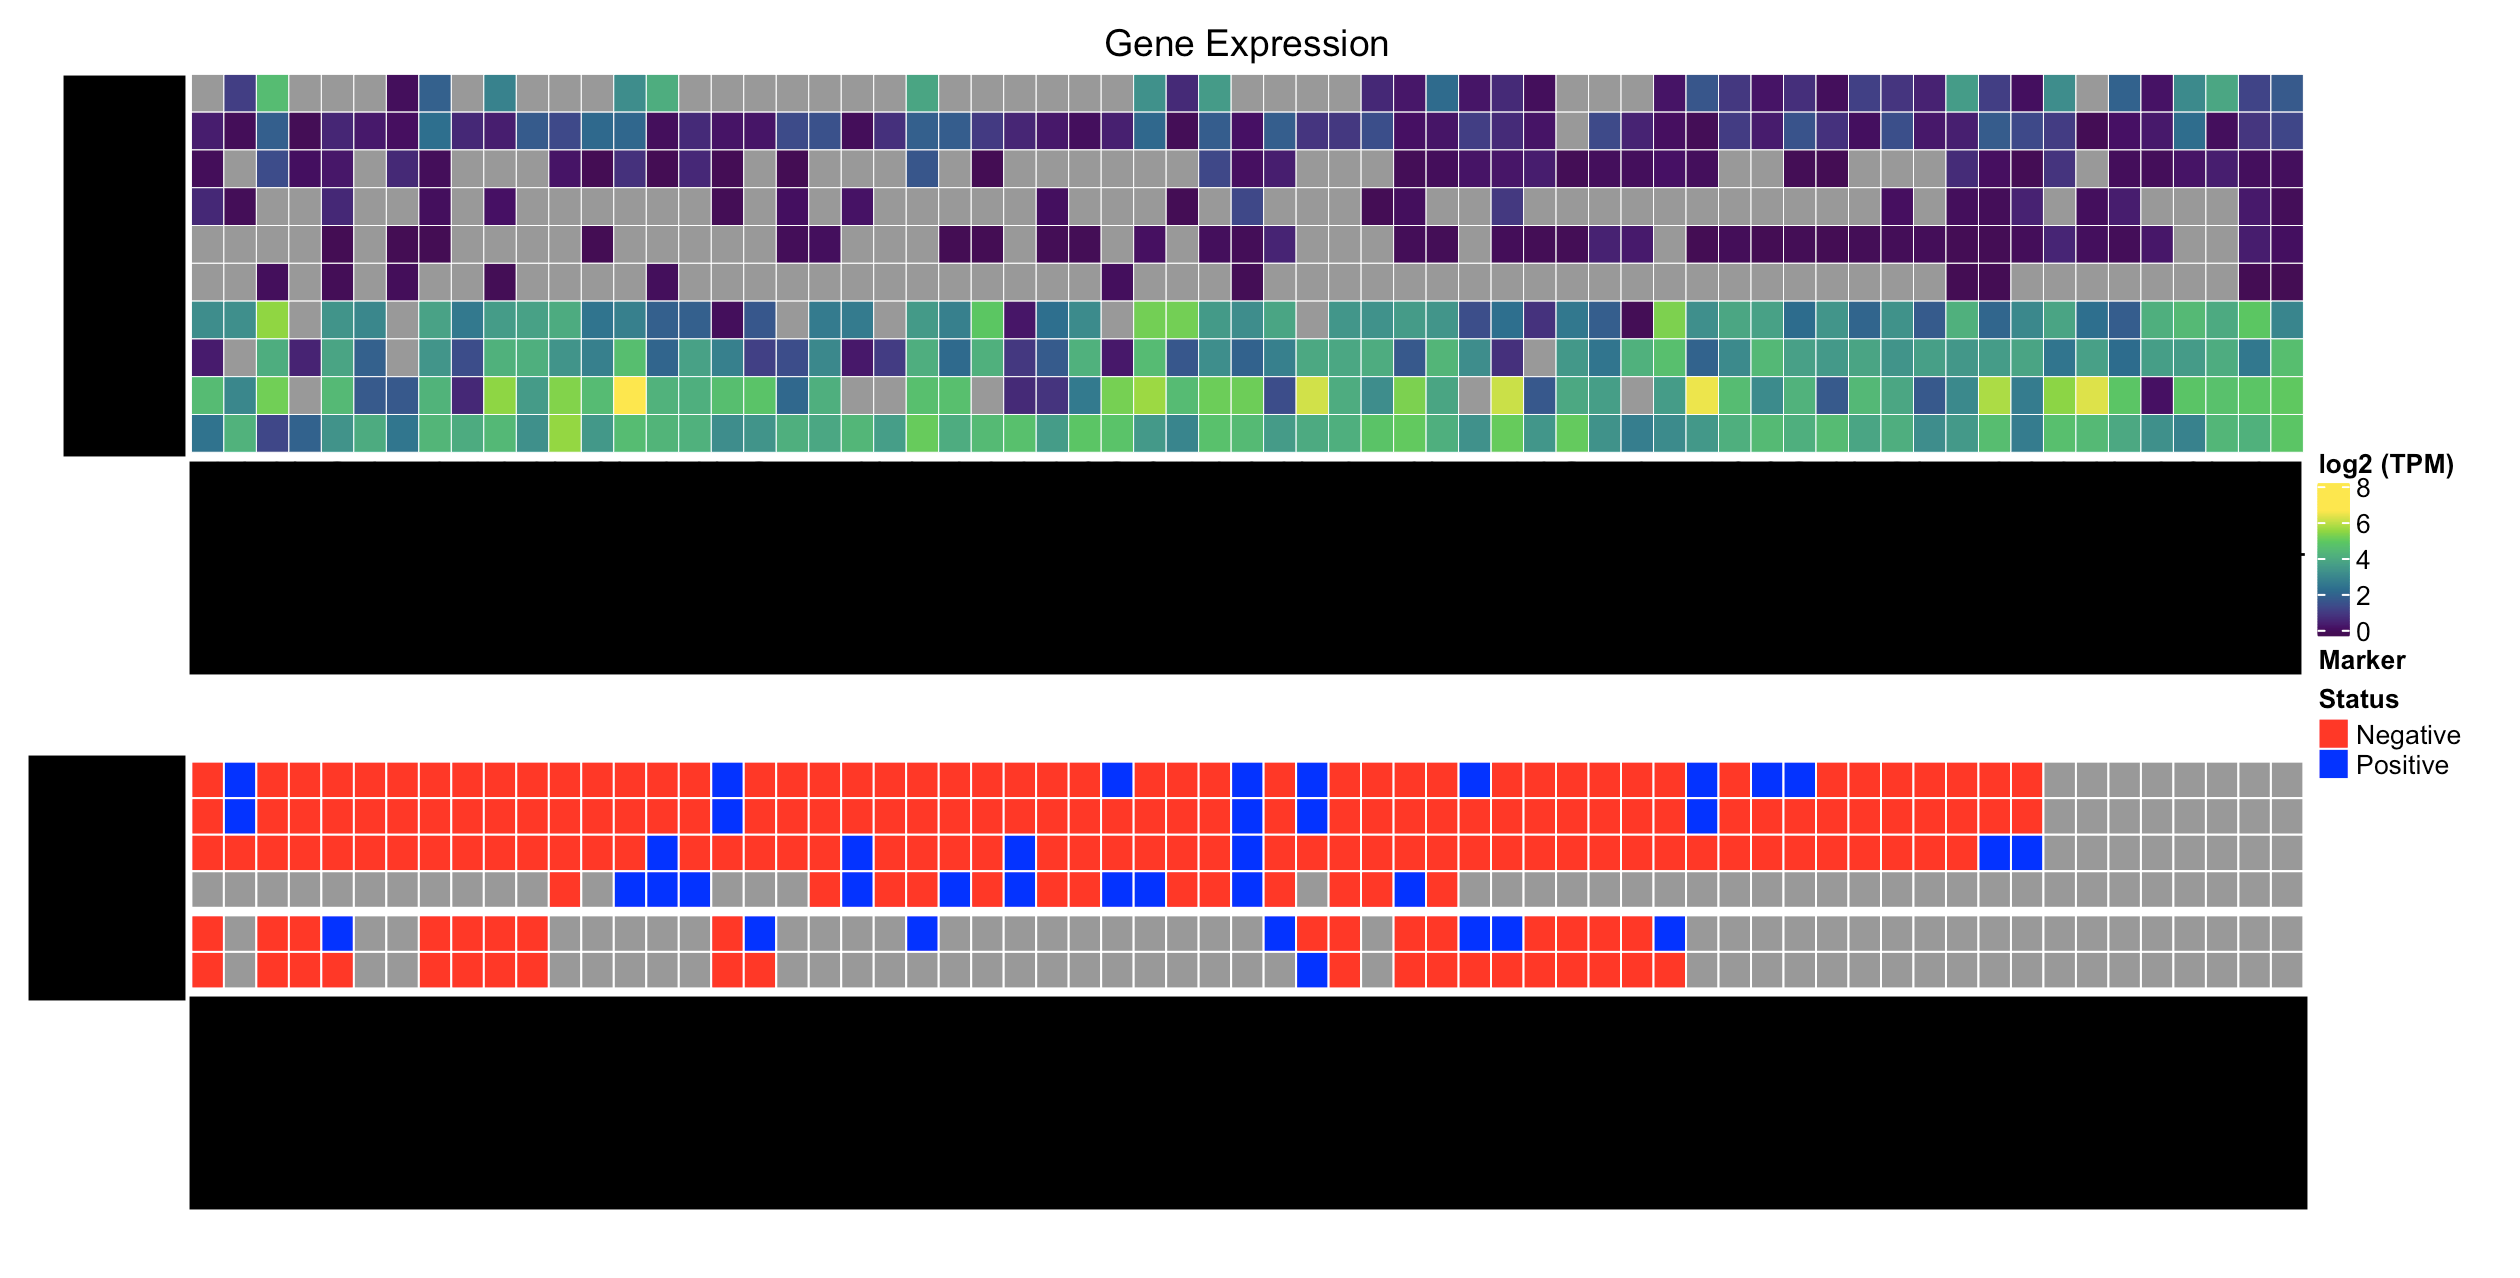
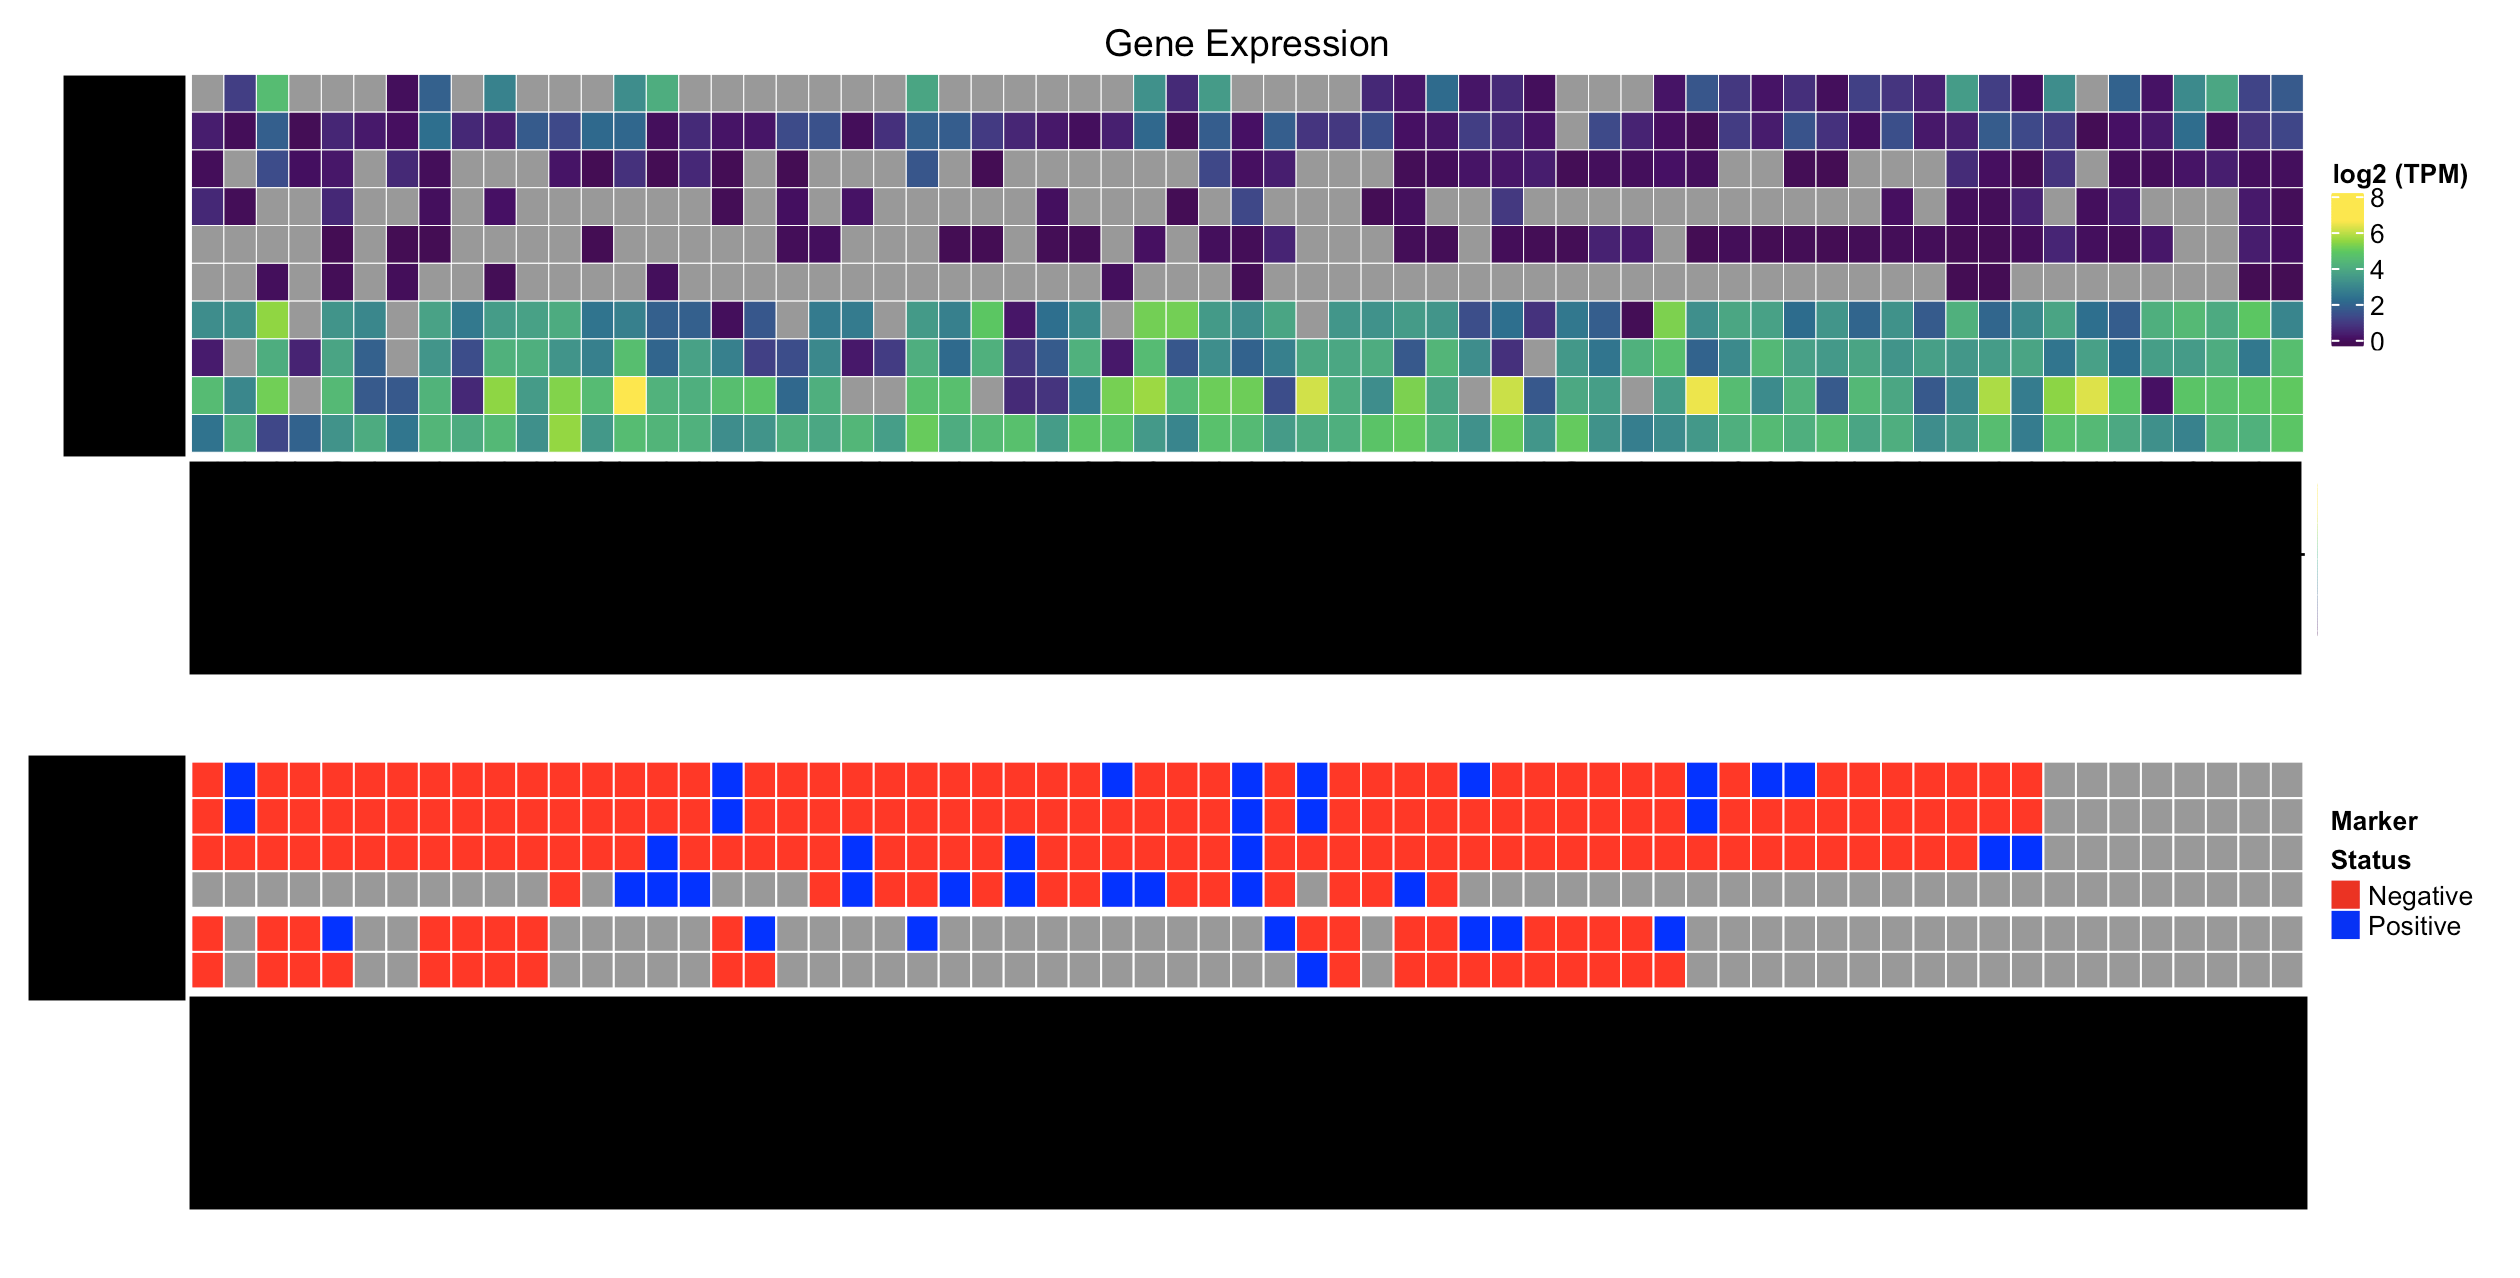
I have created a ComplexHeatmap containing 2 Heatmaps, each with their own legend. The legend on the first Heatmap is continuous, whereas that of the second is discrete.

When I concatenate these Heatmaps vertically, and draw the HeatmapList, their legends are auto-aligned to the center of the plot. Is there any way I can have these legends positioned centered to the respective heatmaps and not to the center of the plot?

This is what I have:

Current_Image

Here's what I'd like to have:

Desired_Image

How can I go about solving this problem? I'd really like to avoid creating customized Legends if I can, but if that's what it takes, that works too.

Thank you in advance for any help/pointers!

Note: I tried adding the ComplexHeatmap tag, but it doesn't exist yet and I don't have the reputation to create new tags yet.

Edit: Since this is a Bioconductor package, I also created an identical post on the Bioconductor support forum

I have created a ComplexHeatmap containing 2 Heatmaps, each with their own legend. The legend on the first Heatmap is continuous, whereas that of the second is discrete.

When I concatenate these Heatmaps vertically, and draw the HeatmapList, their legends are auto-aligned to the center of the plot. Is there any way I can have these legends positioned centered to the respective heatmaps and not to the center of the plot?

This is what I have:

Current_Image

Here's what I'd like to have:

Desired_Image

How can I go about solving this problem? I'd really like to avoid creating customized Legends if I can, but if that's what it takes, that works too.

Thank you in advance for any help/pointers!

Note: I tried adding the ComplexHeatmap tag, but it doesn't exist yet and I don't have the reputation to create new tags yet.

Edit: Since this is a Bioconductor package, I also created an identical post on the Bioconductor support forum

Source Link
Ram RS
  • 2.5k
  • 11
  • 29
Loading