Using Seurat's VlnPlot, how can I remove the black outline around the violin plot?
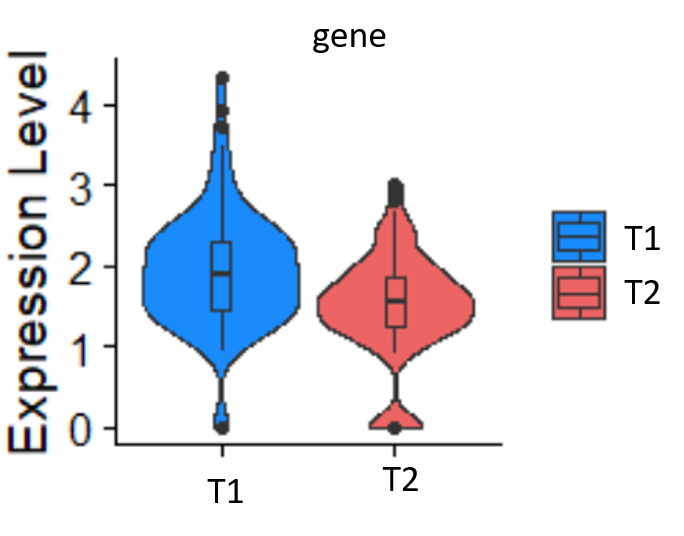
For example, how can I change from the following graph with a (black) outline:
    VlnPlot(ilc2,
        features = "gene",
        split.by = "group",
        cols = c("#198BFD", "#EC6464"),
        pt.size = 0) +
  geom_boxplot(width = 0.1) + theme(aspect.ratio = 1)
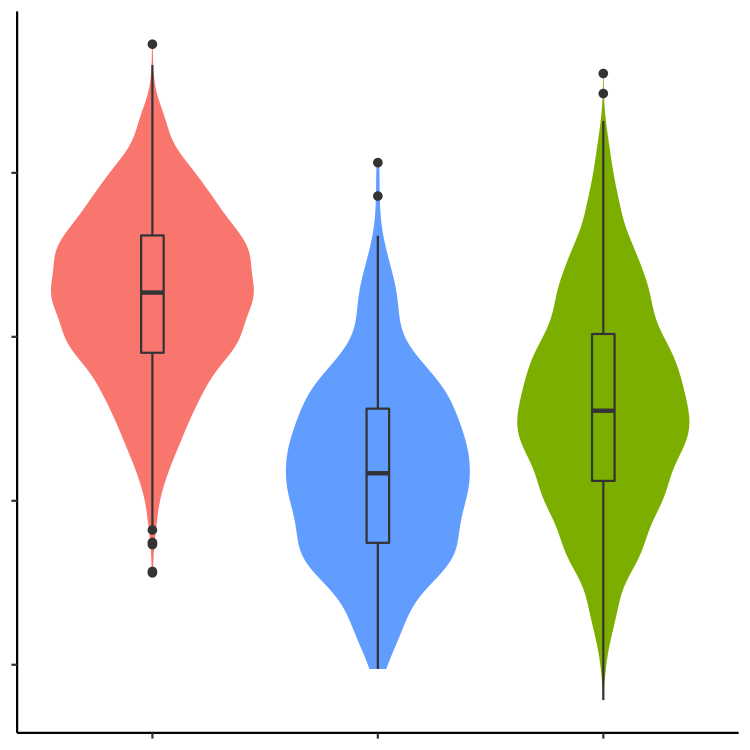
To a graph like the one below, which does not have an outline around the violin plot:

