3
$\begingroup$

enter image description here

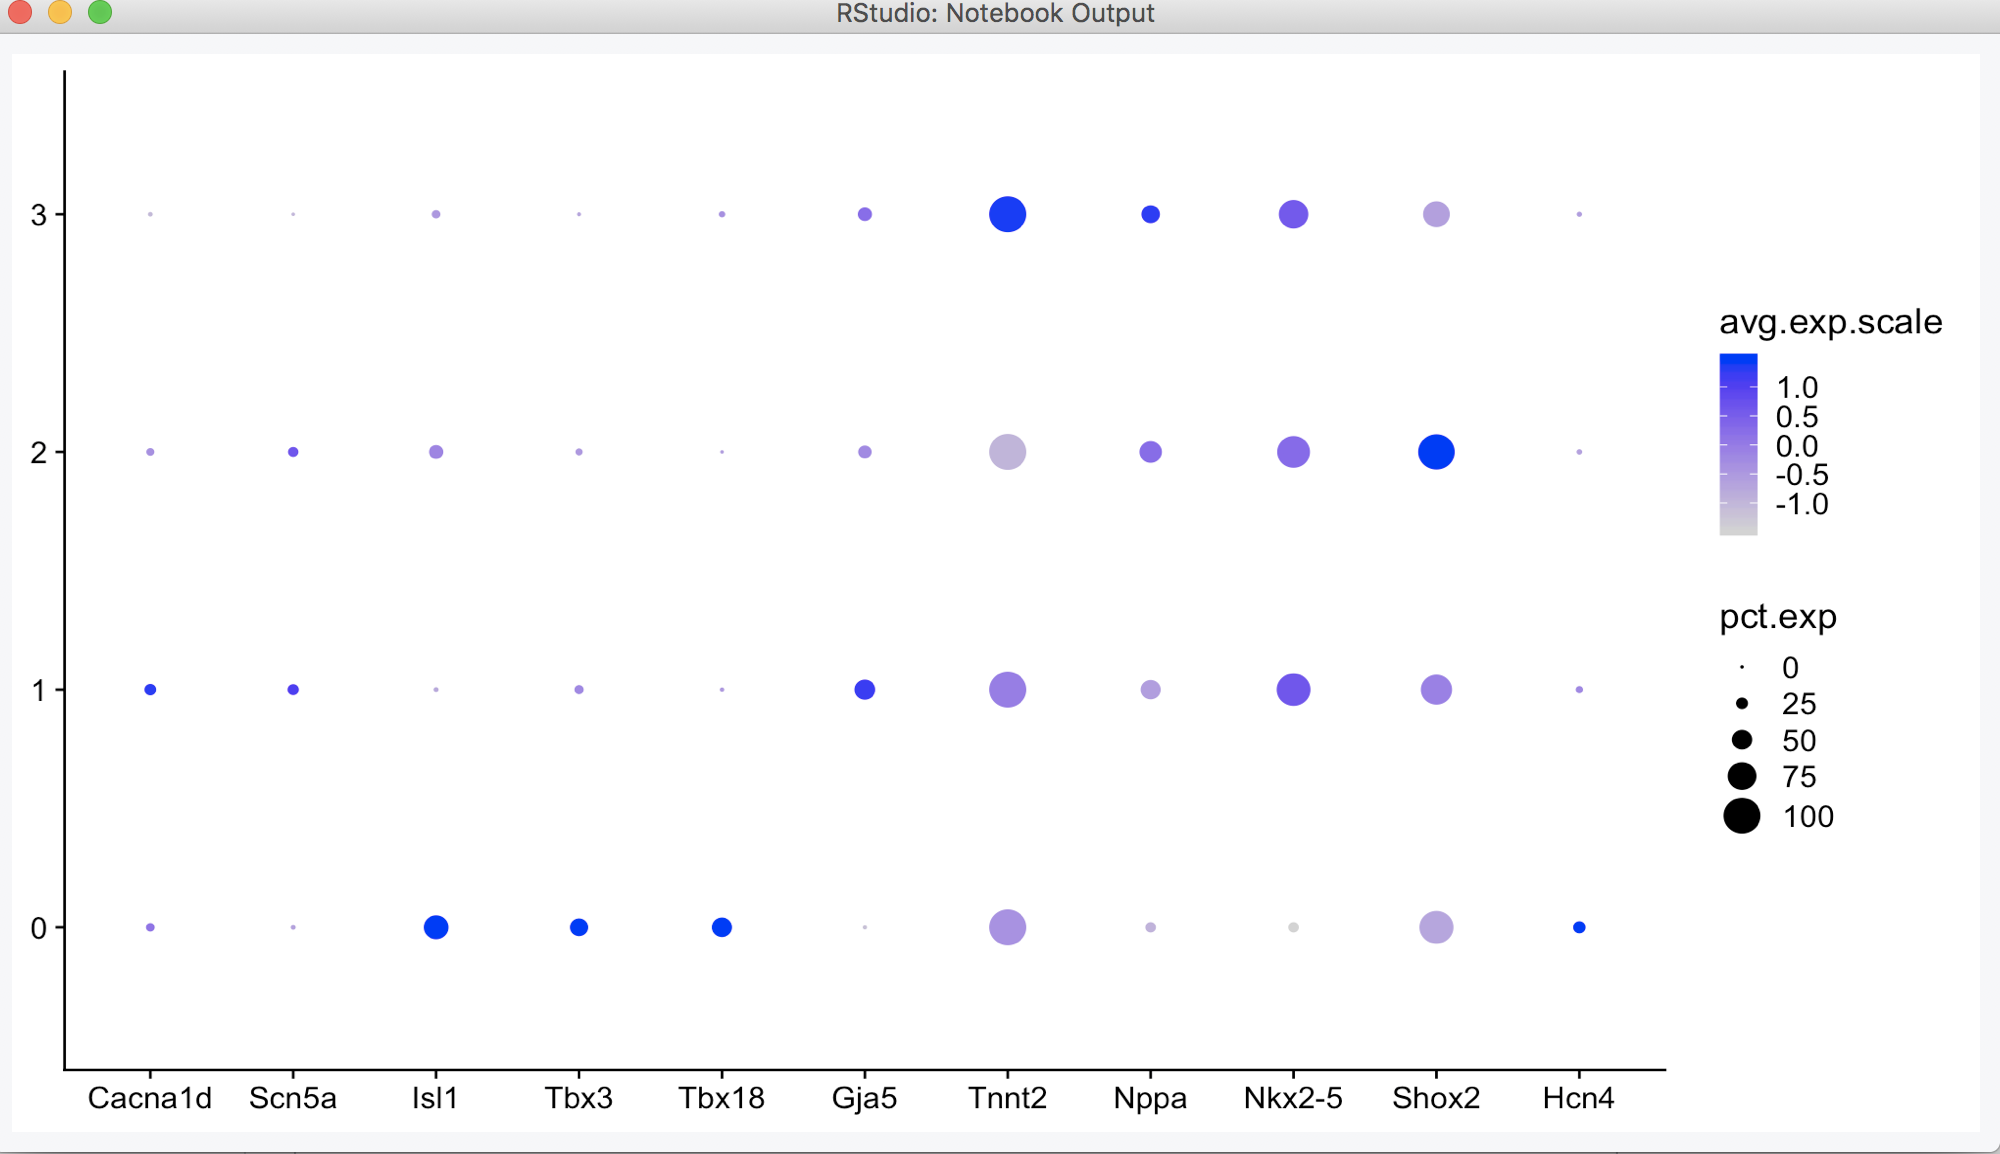
Here is the code I used:

DotPlot(object = cluster, genes.plot = c("Hcn4","Shox2","Nkx2-5","Nppa","Tnnt2","Gja5","Tbx18","Tbx3","Isl1","Scn5a","Cacna1d"),  plot.legend=TRUE)

I was confused about the legend with the Negative number shown for avg.exp.scale. Does it mean that the cluster expressed the genes at low level or that gene was down regulated? (like the Shox2 in the "0" compared with "2").
$\endgroup$

1 Answer 1

3
$\begingroup$

The expression values for each gene are scaled / standardized by subtracting the genes mean expression and dividing by its standard deviation. A value of -1 would imply it's one standard deviation below the mean expression for that gene.

$\endgroup$
3
  • $\begingroup$ Hi, can I ask you another question about the findmarker function in Seurat(satijalab.org/seurat/pbmc3k_tutorial.html) ? Can you tell me it's that possible that the avg_logFC shows negative number? Is it the same explanation as the legend question's answer? $\endgroup$
    – hua
    Commented Oct 28, 2018 at 5:54
  • $\begingroup$ The average log fold change is something like log(x) - log(y) where x and y are the average expression of two different groups. A negative log fold change would mean the average expression of the second group (y) is higher than the first (x) $\endgroup$
    – GWW
    Commented Oct 28, 2018 at 20:24
  • $\begingroup$ Hi, thank you for your explanation. It really makes sense to me. And if the code'cluster1.markers <- FindMarkers(object = pbmc, ident.1 = 1, min.pct = 0.25) print(x = head(x = cluster1.markers, n = 5))' to find all markers of cluster1. Does it mean that x is cluster1 and y is the total cell? $\endgroup$
    – hua
    Commented Oct 29, 2018 at 3:44

Your Answer

By clicking “Post Your Answer”, you agree to our terms of service and acknowledge you have read our privacy policy.

Not the answer you're looking for? Browse other questions tagged or ask your own question.