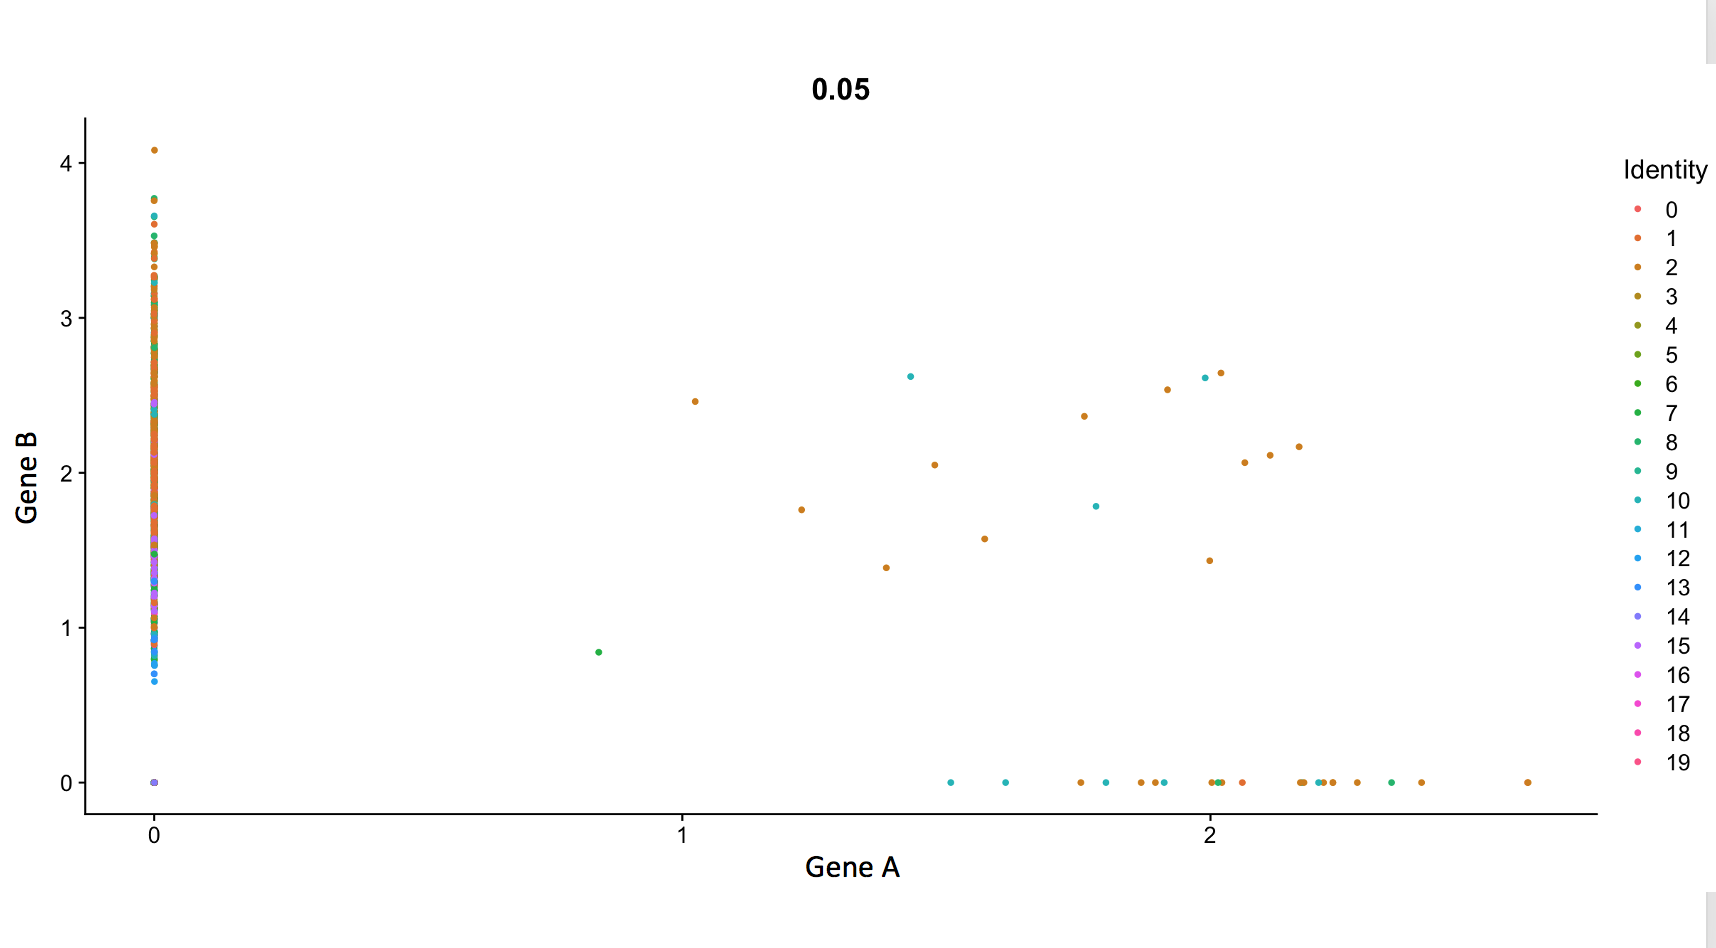
Nowadays, I am trying to calculate Pearson correlation values between two genes of my interest from single-cell RNA-data (features.tsv, barcodes.tsv, and matrix.mtx files) which are obtained from the 10xgenomics cellranger.
FYI, The filtered_feature_bc_matrix includes an aggregated population of tumor-infiltrating immune cells that are derived from 6 different syngeneic mouse tumors (https://www.ncbi.nlm.nih.gov/geo/query/acc.cgi?acc=GSE121861). I downloaded fastq files and ran "cellranger count" and "cellranger aggr" commands to obtain combined data.
My strategy includes the use of the "feature scatter" function deposited in the library(Seurat). Finally, I ended up getting results below.
My question is that can we select a specific cluster(s) or identity on this plot? For example, I want to see correlation values in cluster 2 only. The usage of Feature scatter is as follows.
FeatureScatter( object, feature1, feature2, cells = NULL, group.by = NULL, cols = NULL, pt.size = 1, shape.by = NULL, span = NULL, smooth = FALSE, combine = TRUE, slot = "data" )
Do you know how to get the Pearson correlation of my two genes using Seurat? This is the best I can do.
Thank you.
