I want to identify MDSCs cells which don't not express HLA-DRs (HLA-DR negative) but express CD14, CD33, and ITGAM
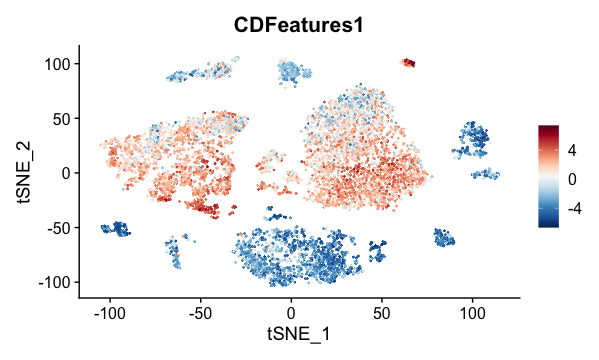
For this, I firstly plotted a feature plot to locate HLA-DR by
cd.features <- list(grep(pattern = '^HLA-DR', x = rownames(x = pbmc_small), value = TRUE))

pbmc_small <- AddModuleScore(object = pbmc_small, features = cd.features, ctrl = 5, name = 'CDFeatures')


FeaturePlot(object = pbmc_small, features = 'CDFeatures1')&
+     scale_colour_gradientn(colours = rev(brewer.pal(n = 11, name = "RdBu")))
Which returned
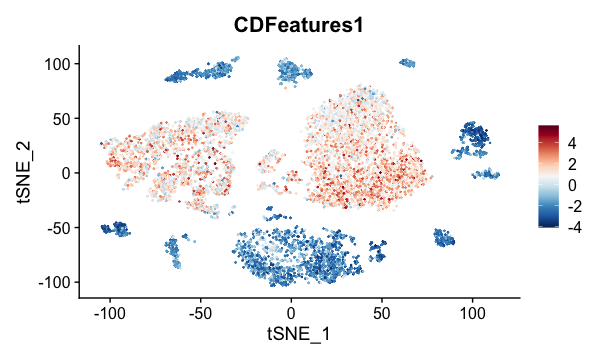
For CD14, CD33, and ITGAM I done
> cd.features=list(c("CD14", "CD33",  "ITGAM"))
> pbmc_small <- AddModuleScore(object = pbmc_small, features = cd.features, ctrl = 5, name = 'CDFeatures')
> FeaturePlot(object = pbmc_small, features = 'CDFeatures1')&
+     scale_colour_gradientn(colours = rev(brewer.pal(n = 11, name = "RdBu")))

>
Which returned
By looking at these two plots I really can not say which part of plot is HLA-DR negative but expressing CD14, CD33, and ITGAM
Do you know a way to do this?
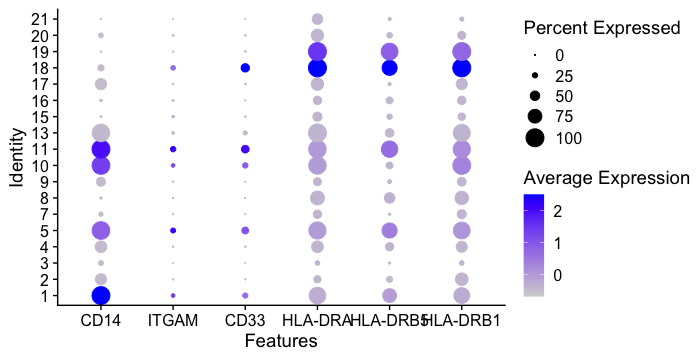
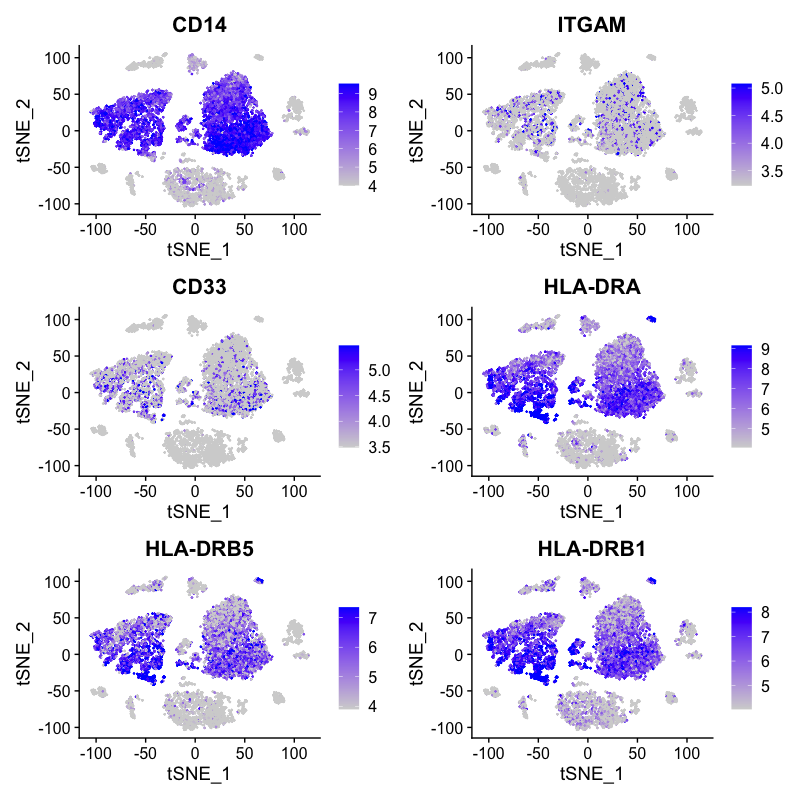
Plotting options don't help because looking at the below plots you can not say which cells are HLA negative and CD14 positive


