1
$\begingroup$

I downloaded c5: gene ontology gene sets file from http://software.broadinstitute.org/gsea/downloads.jsp

I opened the "c5.all.v6.2.symbols.gmt" file in csv format and It looks like below:

enter image description here

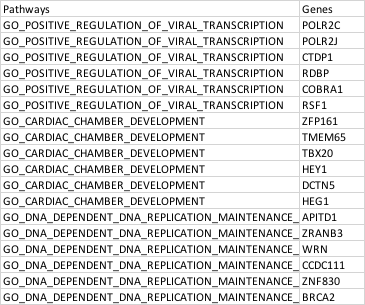
I want to convert the .gmt file into a dataframe. And it should look like below:

enter image description here

can anyone say how I can do that. Thanq

$\endgroup$
5
  • $\begingroup$ This might be an XY problem (you are asking about a problem, but you really have another one). Why do you need this data in data.frame format? Also consider that the GO data is a directed acyclic graph, which has a special structure that should be taken into account $\endgroup$
    – llrs
    Commented Nov 8, 2018 at 12:25
  • $\begingroup$ for some analysis I want the data to be looked like the output I posted. $\endgroup$
    – beginner
    Commented Nov 8, 2018 at 13:17
  • $\begingroup$ Also note that the GO annotations imported by MSigDB are quite old. If you are interested in associations between GO and genes (updated) you should use other sources $\endgroup$
    – llrs
    Commented Nov 8, 2018 at 14:28
  • $\begingroup$ other resources like? $\endgroup$
    – beginner
    Commented Nov 8, 2018 at 14:47
  • $\begingroup$ Like the GO database directly or PANTHER. Or to retrieve the results biomart or its package biomaRt $\endgroup$
    – llrs
    Commented Nov 8, 2018 at 15:41

3 Answers 3

3
$\begingroup$

Ok. Answering my own question.

I did this way. And I got the output I want.

install.packages("msigdbr")
library(msigdbr)

m_df = msigdbr(species = "Homo sapiens", category = "C5")
head(m_df)

Output:

gs_name gs_id gs_cat gs_subcat human_gene_symb~ species_name entrez_gene
  <chr>   <chr> <chr>  <chr>     <chr>            <chr>              <int>
1 GO_14_~ M184~ C5     MF        AANAT            Homo sapiens          15
2 GO_14_~ M184~ C5     MF        AKT1             Homo sapiens         207
3 GO_14_~ M184~ C5     MF        ARRB2            Homo sapiens         409
4 GO_14_~ M184~ C5     MF        BAD              Homo sapiens         572
5 GO_14_~ M184~ C5     MF        DAB2IP           Homo sapiens      153090
6 GO_14_~ M184~ C5     MF        DDIT4            Homo sapiens       54541
# ... with 2 more variables: gene_symbol <chr>, sources <chr>

found this solution from here https://cran.r-project.org/web/packages/msigdbr/vignettes/msigdbr-intro.html

$\endgroup$
1
  • $\begingroup$ perfect! thanks. $\endgroup$
    – Ahdee
    Commented Dec 18, 2019 at 18:19
1
$\begingroup$

You can import the csv file as a table. This does not require further libraries:

#you're reading a csv file, using tab as field separator and considering the first line as the headers of the data table
data <- read.csv(filename, sep="\t", header=TRUE)

then what you need are just two columns of your data:

colnames(data) #will give you the names of the columns that can be accessed
#to access two columns and merge them into a selectedColumns table
selectedColumns <- cbind(data$colName1, data$colName2)
$\endgroup$
2
  • $\begingroup$ The question is tagged with R so it is an R data.frame. $\endgroup$
    – llrs
    Commented Nov 8, 2018 at 12:21
  • $\begingroup$ you're right! I missed it $\endgroup$
    – gbt
    Commented Nov 8, 2018 at 12:51
1
$\begingroup$

You can use GSA.read.gmt function from GSA package. The following code can be used to convert the file to a dataframe. Just ignore the warnings.

Original_response

library(GSA)
data <-  GSA.read.gmt("c5.all.v6.2.symbols.gmt")
gene_names <- unlist(data$genesets, use.names=FALSE)
your_dataframe <- cbind(data$geneset.names,gene_names)
colnames(your_dataframe) <- c("Pathways","Genes")
mydataframe <- as.data.frame(your_dataframe)
head(mydataframe)
                                               Pathway   Gene
1            GO_POSITIVE_REGULATION_OF_VIRAL_TRANSCRIPTION POLR2C
2                           GO_CARDIAC_CHAMBER_DEVELOPMENT POLR2J
3 GO_DNA_DEPENDENT_DNA_REPLICATION_MAINTENANCE_OF_FIDELITY  CTDP1
4                                      GO_CIRCADIAN_RHYTHM   RDBP
5              GO_PHOSPHATIDYLSERINE_ACYL_CHAIN_REMODELING COBRA1
6                               GO_SPINAL_CORD_DEVELOPMENT   RSF1

Edited_response

You can use the code given below to achieve your desired output:

library(GSA)
data <-  GSA.read.gmt("c5.all.v6.2.symbols.gmt")
len_vec=c()           # Now create a vector for containing the length of genes at each position
len_vec[1] = 3
for(i in 1:length(data$genesets)){len_vec[i] <- c(length(data$genesets[[i]]))}
pathway_vec <- unlist(Vectorize(rep.int)(data$geneset.names, len_vec),use.names = FALSE) # Now create a vector for all the pathways in the data 
desired_df <- as.data.frame(cbind(pathway_vec,unlist(data$genesets,use.names = FALSE))) # This gives your desired dataframe
head(desired_df)
                                    Pathway      Gene
1 GO_POSITIVE_REGULATION_OF_VIRAL_TRANSCRIPTION POLR2C
2 GO_POSITIVE_REGULATION_OF_VIRAL_TRANSCRIPTION POLR2J
3 GO_POSITIVE_REGULATION_OF_VIRAL_TRANSCRIPTION  CTDP1
4 GO_POSITIVE_REGULATION_OF_VIRAL_TRANSCRIPTION   RDBP
5 GO_POSITIVE_REGULATION_OF_VIRAL_TRANSCRIPTION COBRA1
6 GO_POSITIVE_REGULATION_OF_VIRAL_TRANSCRIPTION   RSF1
$\endgroup$
1
  • $\begingroup$ sorry, this is wrong. Please check the output I want in the above question. In your output Genes POLR2J, CTDP1, RDBP, COBRA1, RSF1 shows different pathways. $\endgroup$
    – beginner
    Commented Nov 8, 2018 at 13:02

Your Answer

By clicking “Post Your Answer”, you agree to our terms of service and acknowledge you have read our privacy policy.

Not the answer you're looking for? Browse other questions tagged or ask your own question.