Bumped by Community user
added 395 characters in body
Source Link
Zizogolu
  • 2.2k
  • 1
  • 14
  • 46

I have RNA-seq for two groups of patients: Responders to chemotherapy (n=9) versus non-responders to chemotherapy (n=24)

I have done DESeq2 and obtain fold change of responders versus non-responders in which positive fold change means down-regulation in responders (if I am not wrong)

> head(df)
    gene       FC
1 286499 7.116071
2 260436 6.691189
3   2267 5.751322
4   5968 5.522079
5   4103 5.328008
6 442709 5.036087
> 

I have done GSEA in pre-ranked way

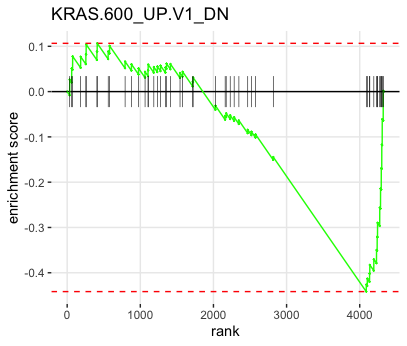
got this plot for KRAS pathway

enter image description here

I interpret this as; KRAS pathway in being down regulated in responders

Am I right?

Please correct me

When I separated genes for up and down regulated

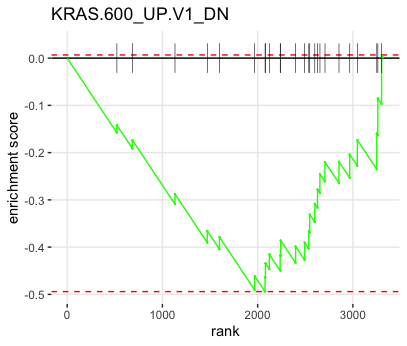
For up regulated genes I did not get any significant GSEA but for down regulated genes in responders I got this

enter image description here

SO does this mean that KRAS pathway is being up regulated in responders because I have used down regulated genes in responders?
I have RNA-seq for two groups of patients: Responders to chemotherapy (n=9) versus non-responders to chemotherapy (n=24)

I have done DESeq2 and obtain fold change of responders versus non-responders in which positive fold change means down-regulation in responders (if I am not wrong)

> head(df)
    gene       FC
1 286499 7.116071
2 260436 6.691189
3   2267 5.751322
4   5968 5.522079
5   4103 5.328008
6 442709 5.036087
> 

I have done GSEA in pre-ranked way

got this plot for KRAS pathway

enter image description here

I interpret this as; KRAS pathway in being down regulated in responders

Am I right?

Please correct me

When I separated genes for up and down regulated

For up regulated genes I did not get any significant GSEA but for down regulated genes in responders I got this

enter image description here

SO does this mean that KRAS pathway is being up regulated in responders because I have used down regulated genes in responders?

Source Link
Zizogolu
  • 2.2k
  • 1
  • 14
  • 46

Interpreting this plot from GSEA

I have RNA-seq for two groups of patients: Responders to chemotherapy (n=9) versus non-responders to chemotherapy (n=24)

I have done DESeq2 and obtain fold change of responders versus non-responders in which positive fold change means down-regulation in responders (if I am not wrong)

> head(df)
    gene       FC
1 286499 7.116071
2 260436 6.691189
3   2267 5.751322
4   5968 5.522079
5   4103 5.328008
6 442709 5.036087
> 

I have done GSEA in pre-ranked way

got this plot for KRAS pathway

enter image description here

I interpret this as; KRAS pathway in being down regulated in responders

Am I right?

Please correct me