2
$\begingroup$

I have RNA-seq for two groups of patients: Responders to chemotherapy (n=9) versus non-responders to chemotherapy (n=24)

I have done DESeq2 and obtain fold change of responders versus non-responders in which positive fold change means down-regulation in responders (if I am not wrong)

> head(df)
    gene       FC
1 286499 7.116071
2 260436 6.691189
3   2267 5.751322
4   5968 5.522079
5   4103 5.328008
6 442709 5.036087
> 

I have done GSEA in pre-ranked way

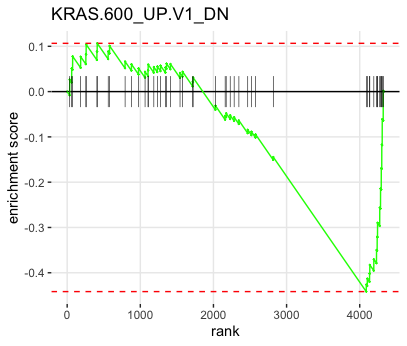
got this plot for KRAS pathway

enter image description here

I interpret this as; KRAS pathway in being down regulated in responders

Am I right?

Please correct me

When I separated genes for up and down regulated

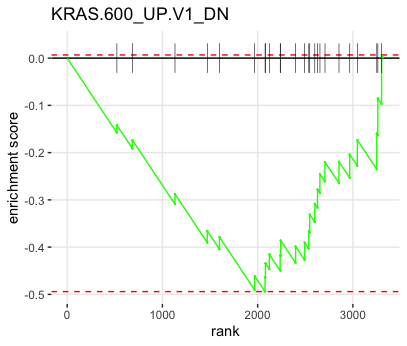
For up regulated genes I did not get any significant GSEA but for down regulated genes in responders I got this

enter image description here

SO does this mean that KRAS pathway is being up regulated in responders because I have used down regulated genes in responders?
$\endgroup$
0

2 Answers 2

1
$\begingroup$

A gene set enrichment analysis (GSEA) tests for enrichment of a gene set within a ranked list of genes.

The primary outcome of the analysis is enrichment or no enrichment. Gene sets frequently include correlated genes, and that correlation can be positive (enhancers or co-expressors) or negative (e.g repressors). It's reasonable to include negatively-correlated genes within gene sets because some pathways involve both enhancement of a particular biochemical pathway, and suppression of a pathway that carries out opposite things.

I don't know about the KRAS pathway you're comparing against here, but a statement I would make based on interpreting that GSEA graph would be something like, "The KRAS.600_UP.V1_DN gene set is enriched when comparing the expression of responders vs non-responders."

I'm not quite sure how you separated up and down-regulated genes (code would be helpful with that). Your down regulated gene plot looks like it's ranked in the opposite direction to the combined plot, which is not what I expect. I think that determining an enrichment score separately for upregulated and downregulated genes (within your ranked list of genes) is a good idea, but it shouldn't change the direction of the enrichment curve within each category. It will, however, alter the form of the curve, by stretching or compressing values vertically and altering the start/end offset.

$\endgroup$
1
$\begingroup$

In Deseq2, it depends on contrast eg. if your contrast <- c("Condition", firstC, SecondC) is then -ve is downregulated in FirstC and same for +ve. It is always better to take look at count data for the confirmation (responders versus non-responders samples).

[for more detail you can refer here][1]

[1]https://github.com/amarinderthind/RNA-seq-tutorial-for-gene-differential-expression-analysis/blob/master/RNA-Seq-DGE.R

$\endgroup$
0

Your Answer

By clicking “Post Your Answer”, you agree to our terms of service and acknowledge you have read our privacy policy.

Not the answer you're looking for? Browse other questions tagged or ask your own question.