3
$\begingroup$

I have a list of kmers and their frequencies broken down like this:

TGCCAA  2
TGGACA  2
TGGGAA  2
TGGTAA  5
TGTCAA  5
TGTGAA  2
TTCCAA  13
TTGAAA  6
TTGCAA  4
TTTAAA  6

And I would like to use clustering to look at the most frequent and the most unique instances of kmers in a sample. I started off following the tutorial found here (https://www.w3schools.com/python/python_ml_hierarchial_clustering.asp#:~:text=Hierarchical%20clustering%20is%20an%20unsupervised,need%20a%20%22target%22%20variable.) using the scikit-learn python package.

However, when I go to implement my data I get a ValueError where it can not convert string to float, which seems obvious as the tutorial uses two sets of numbers and not strings.

I was wondering if there was a known way to cluster kmers and their counts or simply just strings.
$\endgroup$
0

2 Answers 2

2
$\begingroup$

This isn't good data for clustering based on the count value because it needs to be multivariate, e.g. you'd need two or more 'count' columns (if that makes any biological sense). This data is univariate so I'd just use a standard bar chart, personally I would rank the data and consider the underlying distribution.

You could make a tree of the sequence data and the data counts are the labels. If you want to make a tree (hierarchical clustering) then using nucleotide data its becomes a phylogenetic tree, which isn't hierarchical clustering - although clustering can be used to make phylogenetic trees.


K-mers ... if these sites are not homologous a phylogenetic tree is not a good solution: they do look like homologous however. In terms of shifting to numerical variables the technical term is called one-hot-key encoding and scikit-learn has a function for this. This is what Steve is saying. However, understanding what the k-mer represents is kinda important. To perform one-hot-key encoding its:

from sklearn.preprocessing import OneHotEncoder
hot = OneHotEncoder()
.... gets complicated

Alternative approach

import pandas as pd
df = pd.read_csv("kmer.csv")
one_hot_encode = pd.get_dummies(df, columns = ['kmers'])

This code will transform your data to what Steve said .. keeping it as pandas is sort of useful because hierarchical clustering will take a pandas input.

I do have doubts ... the counts column needs a unique identifier in addition to the number, because you'll get identical labels otherwise (my original idea had limitations). Ultimately, I don't precisely know what the kmer value biologically means and thats essential. I would be cautious about dumping that straight into a hierarchical clustering algorithm (it will be in scipy BTW not scikit-learn) .


The following would provide a phylogenetic tree input, but statistically its dodgy without understanding what the k-mer means

import re

kmer = ['TGCCAA', 'TGGACA', 'TGGGAA', 'TGGTAA', 'TGTCAA', 'TGTGAA',  'TTCCAA', 'TTGAAA', 'TTGCAA', 'TTTAAA']

count = [2, 2,  2, 5, 5, 2, 13,  6,  4,  6]

x = [chr(i) for i in range(ord('a'),ord('z')+1)]
n = 0
mydict = {}
for c,k in zip (count, kmer):
    n += 1
    mydict[str(c)+x[n]] = k
    if n > 25:
        n = 0 
for key in mydict:
    if mydict[key] == None:
        continue
    print ('>' + key + '\n' + mydict[key] + '\n')

output

>2b
TGCCAA
>2c
TGGACA
>2d
TGGGAA
>5e
TGGTAA
>5f
TGTCAA
>2g
TGTGAA
>13h
TTCCAA
>6i
TTGAAA
>4j
TTGCAA
>6k
TTTAAA

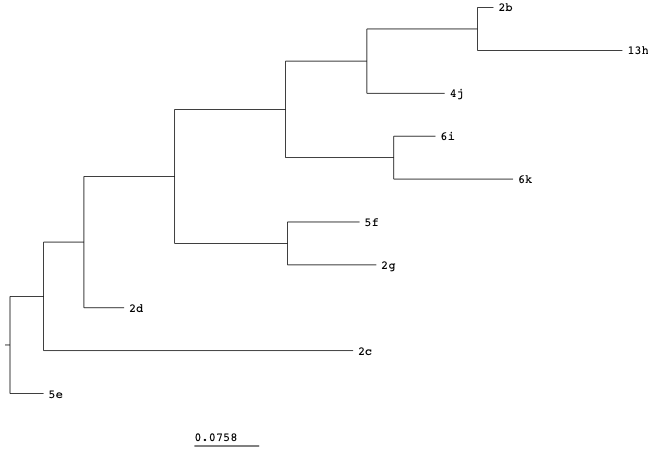
Here's the tree

enter image description here

All I can conclude is count and kmer - with one exception TTTAAA and TTGAAA are not correlated. TTRAAA maybe be a result, possibly.

Here's the matrix.

enter image description here


EDIT Actually there might be a result here: the k-mer representing '13' is a genetic outlier. Whilst it might be difficult to see in the tree I've presented that could proven more decisively. If a bigger sample size demonstrated comparable phenomena - that is a result for certain. So maybe it's not such a bad analysis after all - it could lead to notably interesting result. Hierarchical clustering BTW couldn't generate that results - its assumption base removes the outlier effect.

$\endgroup$
3
$\begingroup$

I think you need some way to convert the k-mer strings into a numerical representation so that they can be clustered. There's a few ways to do this. For example, you could one-hot (or two-bit) encode each k-mer so that each nucleotide is represented as a set of binary values. Or you could just use a simple integer encoding. For example:

def int_encode(kmer):
    two_bit = {'A': 0, 'C': 1, 'G': 2, 'T': 3}
    encoding = []
    for nucleotide in kmer:
        encoding.append(two_bit[nucleotide])
    return encoding

You could then concatenate the output with the frequency counts of each k-mer. For your set of k-mers, your input for clustering would then look like:

[3, 2, 1, 1, 0, 0, 2]
[3, 2, 2, 0, 1, 0, 2]
[3, 2, 2, 2, 0, 0, 2]
[3, 2, 2, 3, 0, 0, 5]
[3, 2, 3, 1, 0, 0, 5]
[3, 2, 3, 2, 0, 0, 2]
[3, 3, 1, 1, 0, 0, 13]
[3, 3, 2, 0, 0, 0, 6]
[3, 3, 2, 1, 0, 0, 4]
[3, 3, 3, 0, 0, 0, 6]
$\endgroup$

Your Answer

By clicking “Post Your Answer”, you agree to our terms of service and acknowledge you have read our privacy policy.

Not the answer you're looking for? Browse other questions tagged or ask your own question.