For proteins and molecules in general, and within the meaning of this paper, "internal coordinates" are any representation that are not dependent on the molecule rotation or translation in a Cartesian space.
Calling them "internal coordinates" may be slightly confusing, and a more correct term could be "internal representation"
That means, I guess, that internal coordinates could be, as you mention, a list of vector in a Cartesian space, where the Cartesian space "orientation" would be decided by, say, principle component analysis (or any other arbitrary rule depending on the molecule). This however defeats the purpose of most internal representations: dimensionality reduction or faster computations.
Other (more interesting) ways of representing a molecule in internal coordinates would be:
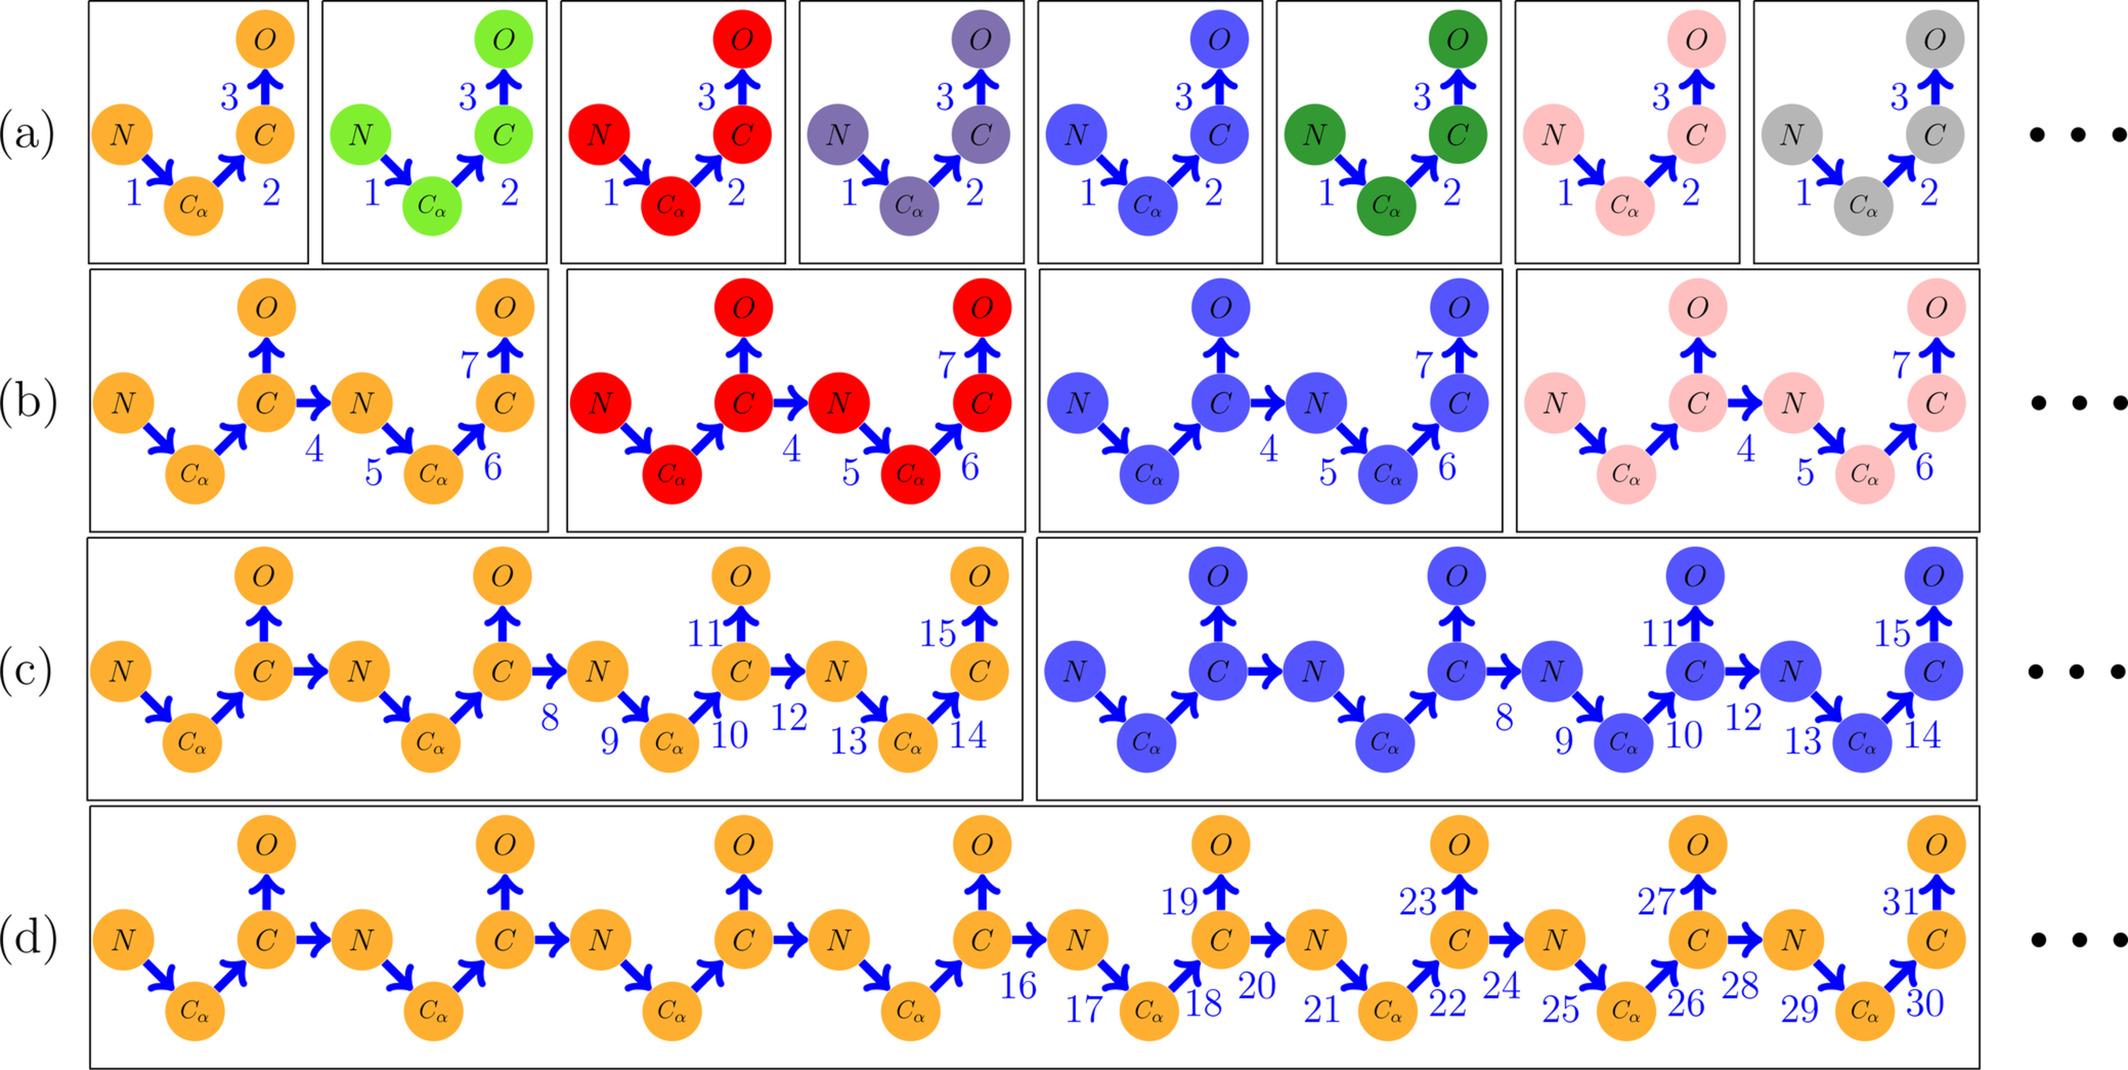
As (Bayati, Lardan & Bardhan 2020) focus on: a set of bond distance, angle, and dihedrals (see Ramachandran plots and rotamers). This is especially useful in the case of proteins. This representation is for example used by Rosetta. Angles and bond distance can be considered as constant (depending on the atomic type), and so one can infer the Cartesian coordinates of multiple atoms with just one dihedral angle, hence providing a huge dimensionality reduction. In this case there is no need for vector. Also, in the case of internal energy computation there is always one energy term depending on dihedrals, so that is already done. Limit of such methods is that in molecular constructs there are energy terms due to long-range interactions, i.e van der waals and electrostatics. There is hence a need in such software to always switch between a Dihedral representation and a Cartesian representation. Another problem is that proteins backbone are then represented as a dihedral "chain", and so the Cartesian coordinates of one atom becomes tightly linked to the previous one, which are linked to the previous one, etc. This is the problem this paper is trying to deal with.
As (Tan et al. 2023) use, a graph representation. Graphein is an interesting python library for converting and analyzing proteins and molecules from cartesian coordinates to graph representation. In this case instead of having a vector, each atoms position is defined as its distance with surrounding atoms. This kind of representation has received more and more attention from the protein structure prediction & design community as it is particularly suited for neural networks. For example I would say the protein representation in AlphaFold is a kind of graph representation (using "triangles" made by the distance between three atoms). In comparison to dihedral representation, graph representation packs less "assumption" about the system and are even worst than Cartesian representation in terms of dimension (if you do a "global" representation of N atoms then you end up with N! values vs only 3*N with Cartesian), but at least things like non-covalent interactions are implicitly represented.
I believe this answer gives enough material to look at. If this still appears unclear, skimming through Rosetta tutorials / papers figures / webinars should provide ample explanations, same for AlphaFold.
