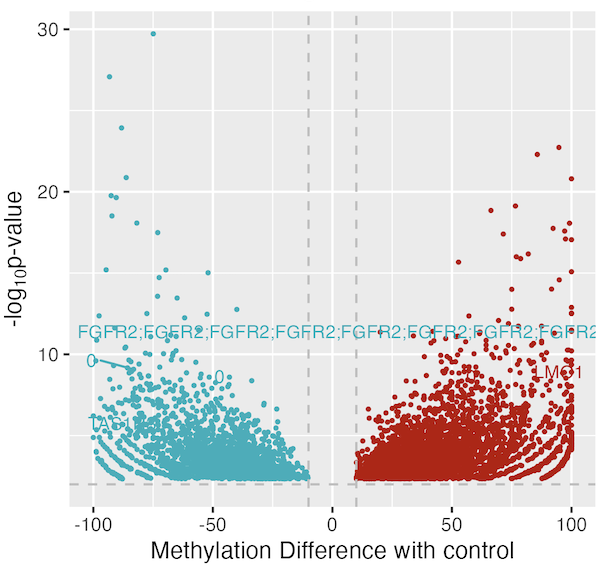
I'm wondering how can I show unique gene names in the volcano plot.
My data looks like,
head(DMCf1_huMetGNc)
     chr    start    end.x       pvalue       qvalue meth.diff        gene
152 chr1 24909805 24909805 1.915400e-03 0.0168087962 -52.00000 RUNX3;RUNX3
168 chr1 24931440 24931440 8.645625e-03 0.0489503201  28.98551 RUNX3;RUNX3
179 chr1 26862096 26862096 1.308307e-04 0.0023224596 -42.48366         SFN
187 chr1 26914178 26914178 4.508416e-06 0.0001786963 -57.97872       NR0B2
188 chr1 26914203 26914203 5.337425e-05 0.0011910452 -47.30424       NR0B2
194 chr1 35573100 35573100 1.433689e-03 0.0135780139 -42.04545      TFAP2E
The original data file is quite large, here under the gene column some of the rows have multiple same gene names separated by ;. How can I show only unique gene names.
No pattern of gene names exists when multiple names are present. In certain cases, the same gene is repeated, while in other cases, distinct genes are present in the same cell. The majority of the time, a single gene exists in a cell.
library(ggplot2)
library(ggrepel)
    v1<-ggplot(data=DMCf1_huMetGNc, aes(x=meth.diff, y=-log10(pvalue) )) + geom_point()
    v1+geom_text_repel(aes(label= gene))
Here, you may see how the FGFR2 gene is repetitive in the plot that I want to remove and the same name from a single row should appear only once in the plot.

A;B;A, you wish to showA;Band if there'sA;A, you want justA? $\endgroup$