2
$\begingroup$

I have no idea why I used the subsetdata in Seurat after using CCA the TSNEPlot shows the cluster all in the left side and merge, did I miss something? Here are the code and figure I got.

cluster <-SubsetData(object = immune.combined, ident.use= "3")

cluster <- NormalizeData(object = cluster, normalization.method = "logNormalize", scale.factor = 10000)


cluster <- FindVariableGenes(object = cluster, mean.function = ExpMean, dispersion.function = LogVMR, x.low.cutoff = 0, x.high.cutoff = 6, y.cutoff = 0, do.plot = F)


cluster <- ScaleData(object = cluster, display.progress = FALSE)
cluster <- RunPCA(object = cluster, pc.genes = [email protected], pcs.print = 1:10, genes.print =5)


PCAPlot(object = cluster, group.by= "orig.ident", dim.1 = 1, dim.2 = 2)

cluster <- FindClusters (object = cluster, reduction.type = "pca", dims.use = 1:10, resolution =0.3, print.output = 0, save.SNN = TRUE, force.recalc = T)

TSNEPlot(object = cluster, do.label = TRUE,do.return = TRUE,pt.size = 2,label.size = 5, no.legend=FALSE)
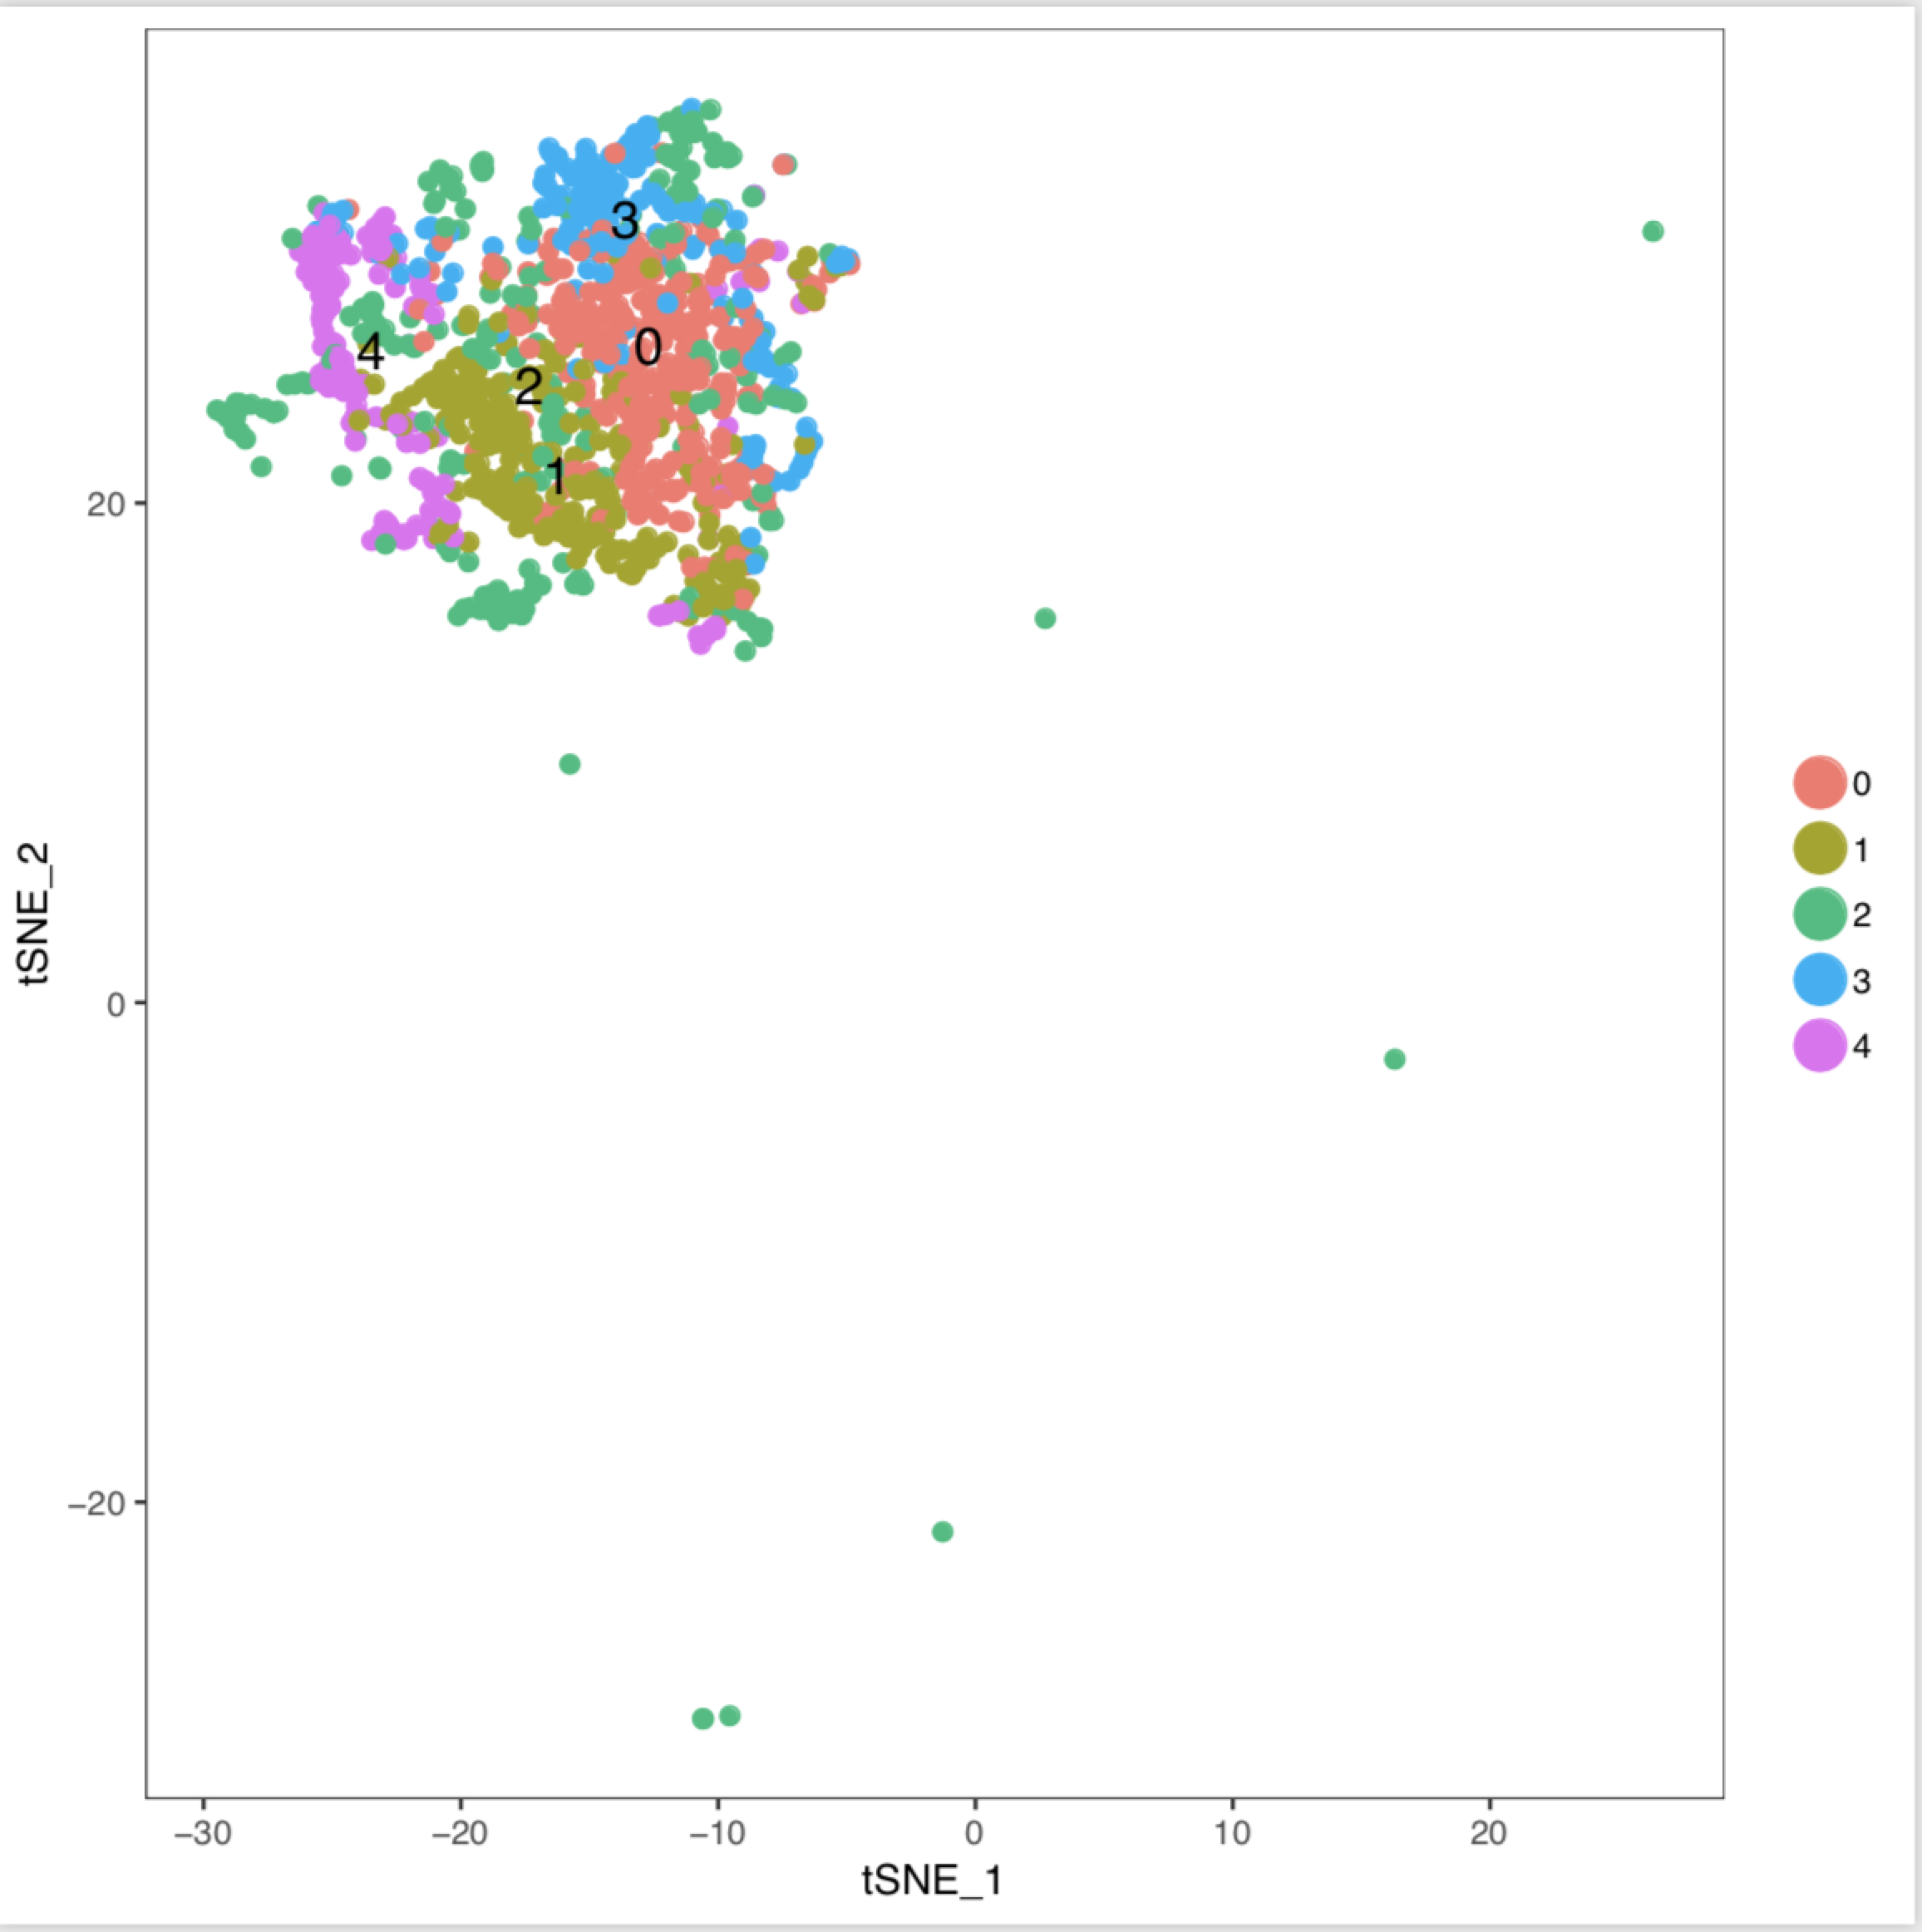
enter image description here

$\endgroup$
5
  • $\begingroup$ I'm not familiar with Seurat, what exactly is the data your are performing your tSNE analysis on? 50 principle components of your differentially expressed genes of scRNA data? $\endgroup$
    – Pallie
    Commented Mar 1, 2019 at 9:33
  • $\begingroup$ The lack of data transformations in Seurat is worrying ("logNormalize" is the only one). The idea of "one size fits all" is never cool in biology. I don't know Seurat RNA-seq, but I know the surrounding statistics. Have you done a PCA plot? $\endgroup$
    – M__
    Commented Mar 1, 2019 at 14:34
  • $\begingroup$ I mean, we can't really tell how dense those isolated clusters are in the other three quadrants. How many cells do you have? tSNE is stochastic and depends heavily on parameters, so default settings aren't good for every data set. I'd recommend having a look at this blog post, and then rerunning using several different parameter settings. $\endgroup$
    – merv
    Commented Mar 1, 2019 at 15:06
  • 1
    $\begingroup$ Sometimes low quality or outlier cells can "push" the rest of your data to one side of a tSNE plot. You would probably see a pattern like this in one of the principle components as well. I would try to isolate the cells and look at their expression and if they do look like they are low quality you can likely remove them from your analysis. $\endgroup$
    – GWW
    Commented Mar 1, 2019 at 15:15
  • 1
    $\begingroup$ I don't see CCA anywhere in your code. Is that a typo? Should be PCA? $\endgroup$
    – merv
    Commented Mar 1, 2019 at 15:19

2 Answers 2

1
$\begingroup$

The issue here is simply that you did not re-compute the tSNE after subsetting the data, so you're looking at a subset of cells from a larger embedding. You would never get an embedding that looks like that by running tSNE on only those cells.

You also don't need to re-normalize the data after subsetting the cells. Since this is a per-cell calculation, the results will be identical to those in the larger matrix (you can check this for yourself).

$\endgroup$
2
  • $\begingroup$ Hi TimStuart, I have tried no normalization and no scale and found out it is no a difference between the one I scale and normalization them. Do you know what's the problem it is?@TimStuart $\endgroup$
    – hua
    Commented Mar 5, 2019 at 3:46
  • 1
    $\begingroup$ Scale data will be different, normalize data will not be different. You need to compute a new tSNE: cluster <- RunTSNE(object = cluster, reduction.type = 'pca', dims.use = 1:10) $\endgroup$
    – TimStuart
    Commented Mar 5, 2019 at 14:50
1
$\begingroup$

I'm going to stick my neck out here. Overall PCA followed by tSNE is a very powerful method of unsupervised learning however, I agree with @GWW,

cluster <- ScaleData(object = cluster, display.progress = FALSE)

If this is a max-min rescale transformation (common in supervised learning) then the outliers will badly affect the clustering. You can remove outliers that are over 2 sd from a formal analysis and re-run the calculation. That is just the risk of a max-min rescaling.

The one issue I'm concerned about is the initial quasi-standardisation followed by log-transformation,

log1p(value/colSums[cell-idx] *scale_factor)

In this case you are multiplying by 10000, this is to remove the ratio (used as a quasi-standardisation) and then taking the log ??? That is not the way to transform a ratio, it would be better to take the reciprocal of the ratio. There are other (better) methods, a formal standardisation would be useful, before a transformation is considered. Possibly if that was done correctly you wouldn't have the problem of outliers potentially crunching your data.

If you fiddle with the parameters you might get something - but its a symptom not the cause of the problem. However, if removing the outliers works (I have not checked the ScaleData function), then you are sorted and all else is forgotten (at least for this data set). The information I read was here.

$\endgroup$
5
  • $\begingroup$ What is the issue with log1p(counts_per_10k)? This is a common way to normalize for different sequencing depth between cells $\endgroup$
    – TimStuart
    Commented Mar 1, 2019 at 16:51
  • $\begingroup$ If the scale factor is based on an underlying biological reading (cell count) -- no problem at all. To multiply by 10000 default suggests this isn't a standardisation (because the scale factor would be variable). Standardisation against a control is a better approach IMO to offset experimental variation between runs. $\endgroup$
    – M__
    Commented Mar 1, 2019 at 21:19
  • $\begingroup$ The scale factor is variable, it is the total counts for the cell (ie colSums(cell)). We then multiply this by some large constant value (1e4,5,6 etc) to avoid dealing with small numbers $\endgroup$
    – TimStuart
    Commented Mar 1, 2019 at 21:51
  • $\begingroup$ It doesn't appear to being used like that in the above code. The default value set in the documentation was the default value used by the OP $\endgroup$
    – M__
    Commented Mar 1, 2019 at 21:58
  • $\begingroup$ Sorry this is a bit confusing because I used the term "scale factor" above referring to the cell-specific scaling factor, not the argument in the function. The argument scale_factor in the function refers to the constant scale factor (by default 10000). A cell-specific scale factor does not need to be specified as it is calculated as the sum of counts in the cell. In the code above, colSums[cell-idx] is the cell-specific factor and scale_factor is an arbitrary constant set by default to 10000 $\endgroup$
    – TimStuart
    Commented Mar 1, 2019 at 22:09

Your Answer

By clicking “Post Your Answer”, you agree to our terms of service and acknowledge you have read our privacy policy.

Not the answer you're looking for? Browse other questions tagged or ask your own question.