Update 2
Ok, for what I expect will be my final update for this answer, I compared the following:
samtools 1.14 + zlibsamtools 1.15 + libdeflate (this is a different version, but shouldn't have a major effect. They released a new version just before I asked cluster admins to compile against libdeflate and didn't notice until later.)sambamba v0.8.2
Note: This time I used the following settings:
- Only two samples instead of three
- Max
Nextflow queue size of 30 to avoid too many threads reading from the same two files.
- I tested CPU requests from 1 to 7 (step size 1) and then from 9 to 17 (step size 2).
- For jobs where I allotted few CPUs and low memory, I provided a 200% buffer to prevent the jobs from failing with
OUT OF MEMORY errors. i.e., I gave the SLURM job 2x the amount of memory than I told the tools they could use. sambamba was the worst offender for exceeding memory in these conditions, but I gave them all 200% buffer to keep comparisons equal.
Seems pretty clear to me that sambamba is the fastest and uses requested CPU resources most efficiently (i.e., is able to use all of the CPUs requested up until ~8 or 9 CPUs). For reference, the difference between sambamba and samtools + libdeflate with 9 CPUs is ~10 minutes on average.
We will certainly be using sambamba going forward, probably with ~9 CPUs and ~9GB per thread since I had to provide a 200% buffer in lower CPU/Mem jobs to avoid job failure, anyway.
Again, all code and results are available on my GitHub repository (Samtools sort optimization test).
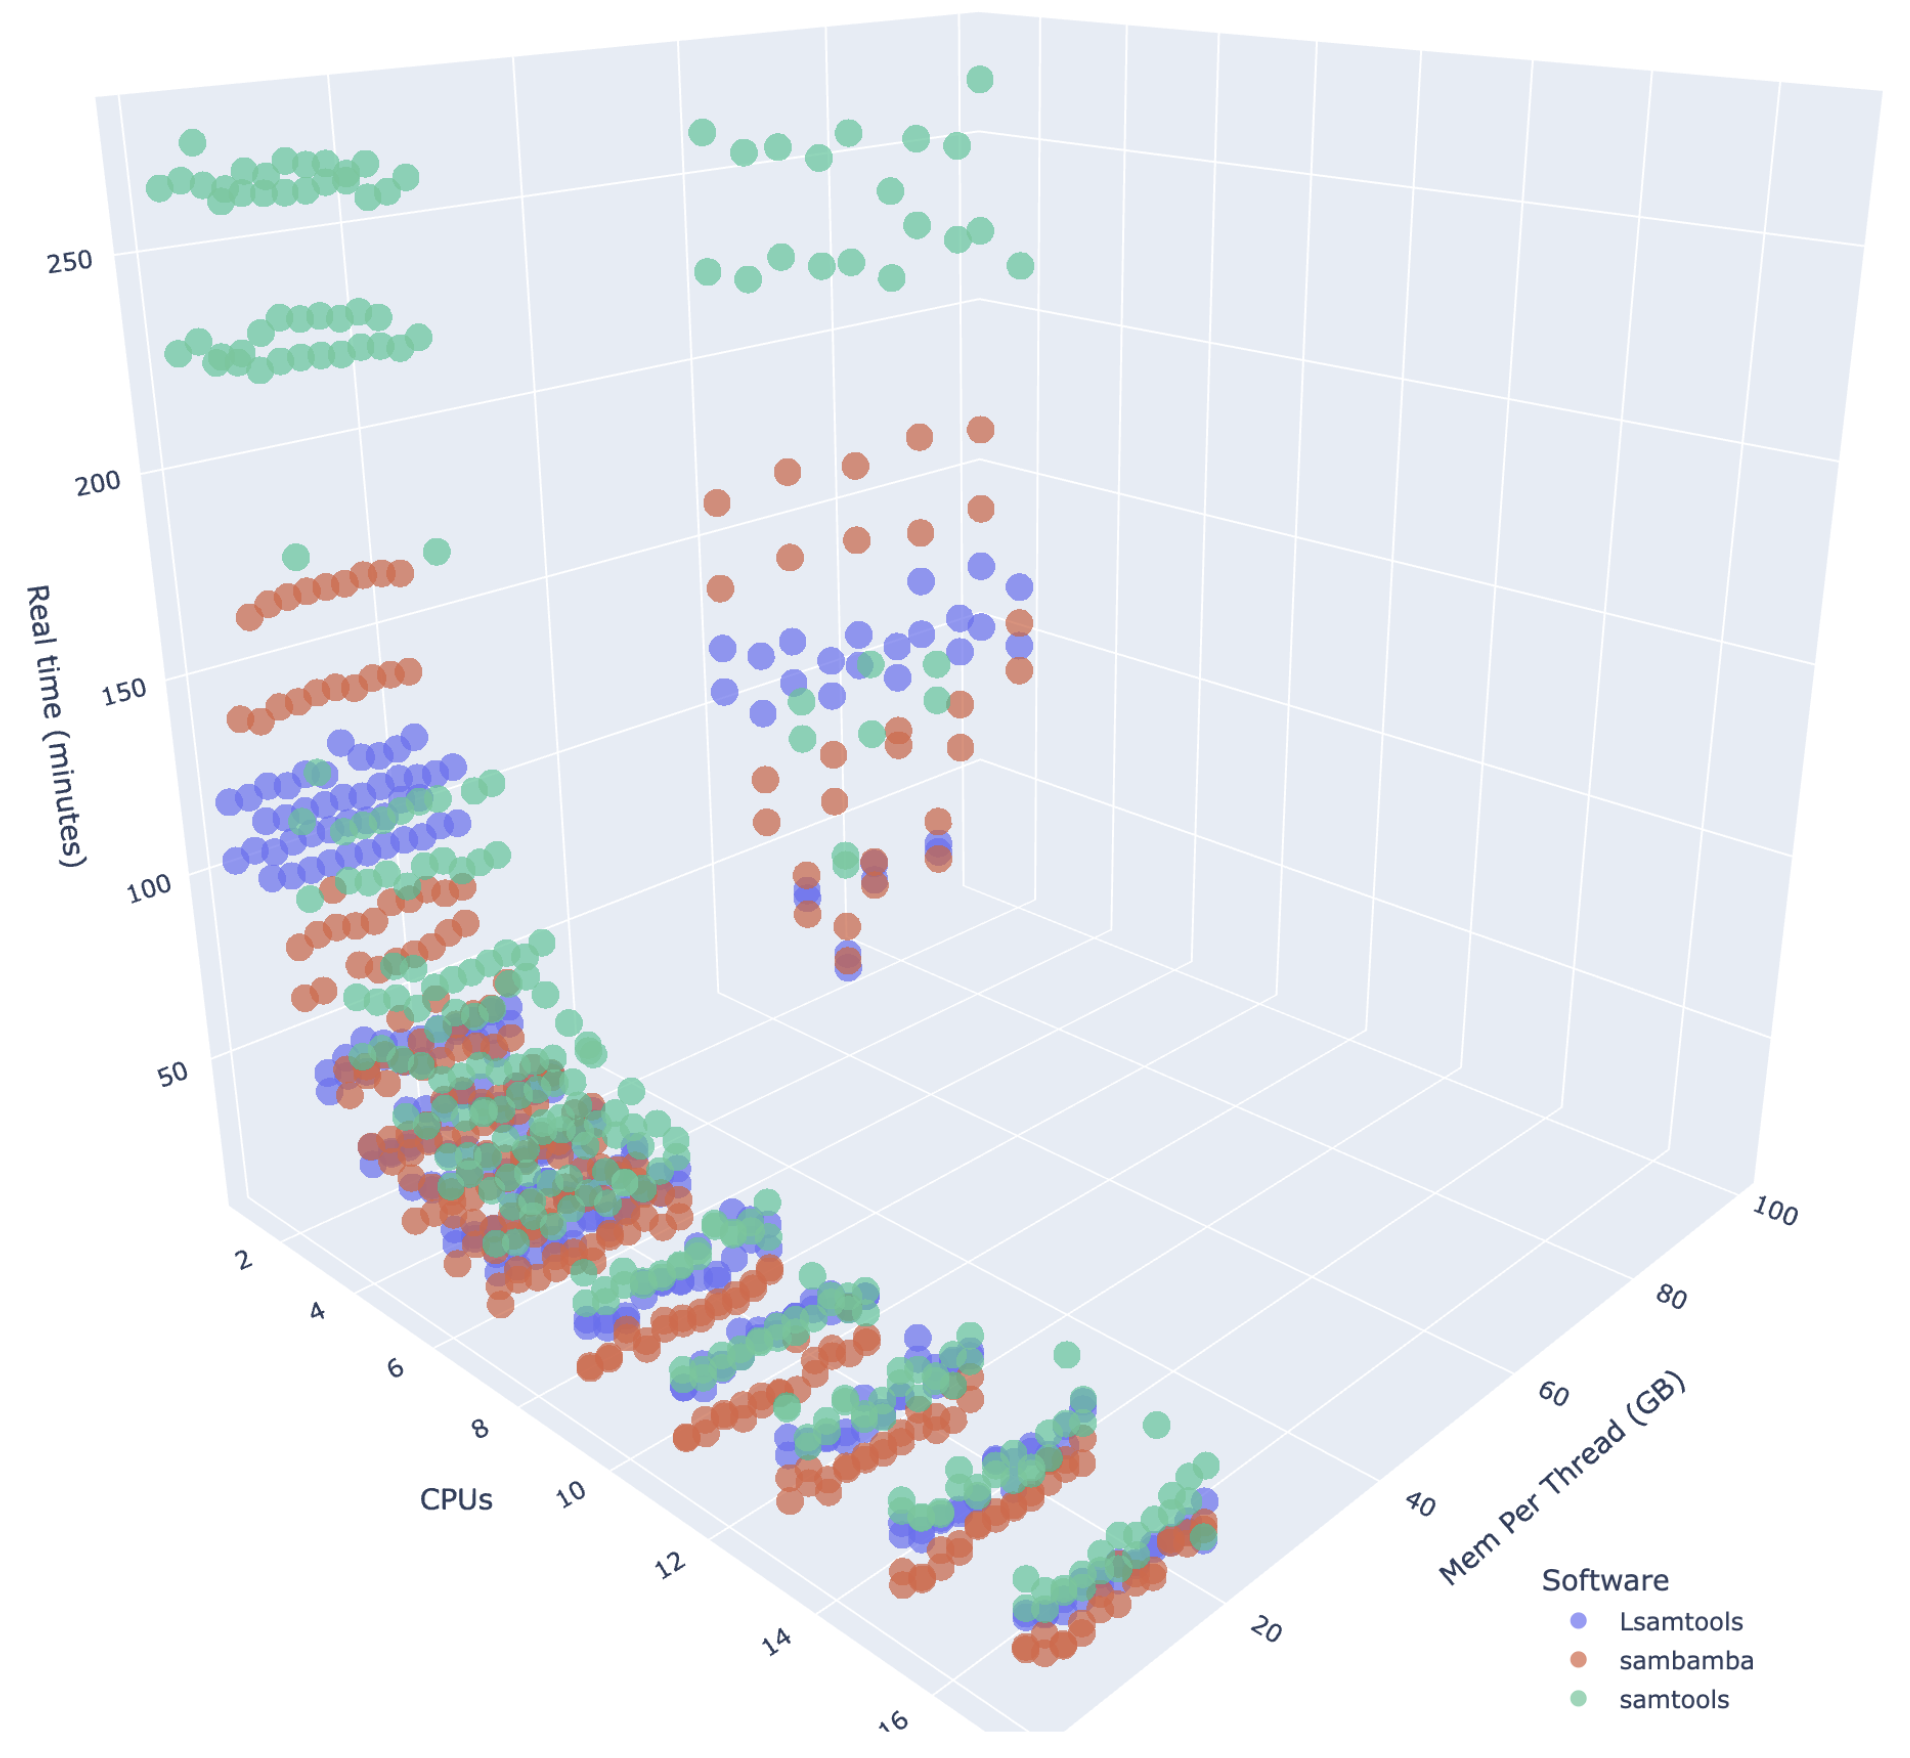
(Angle 1) Comparison between samtools + zlib, samtools + libdeflate (Lsamtools), and sambamba
Here, I'm showing the general trend that real time decreases with increased CPUs for all three tools, but Mem Per CPU doesn't have a huge effect. sambamba out performs samtools + zlib regardless of settings. samtools + libdeflate out performs samtools + zlib until ~11 CPUs, where they perform the same (plot 3 below explains why).
Interesting finding: samtools + libdeflate performs better than sambamba with a single thread, but sambamba takes over from there as CPUs increase (again, plot #3 explains why).

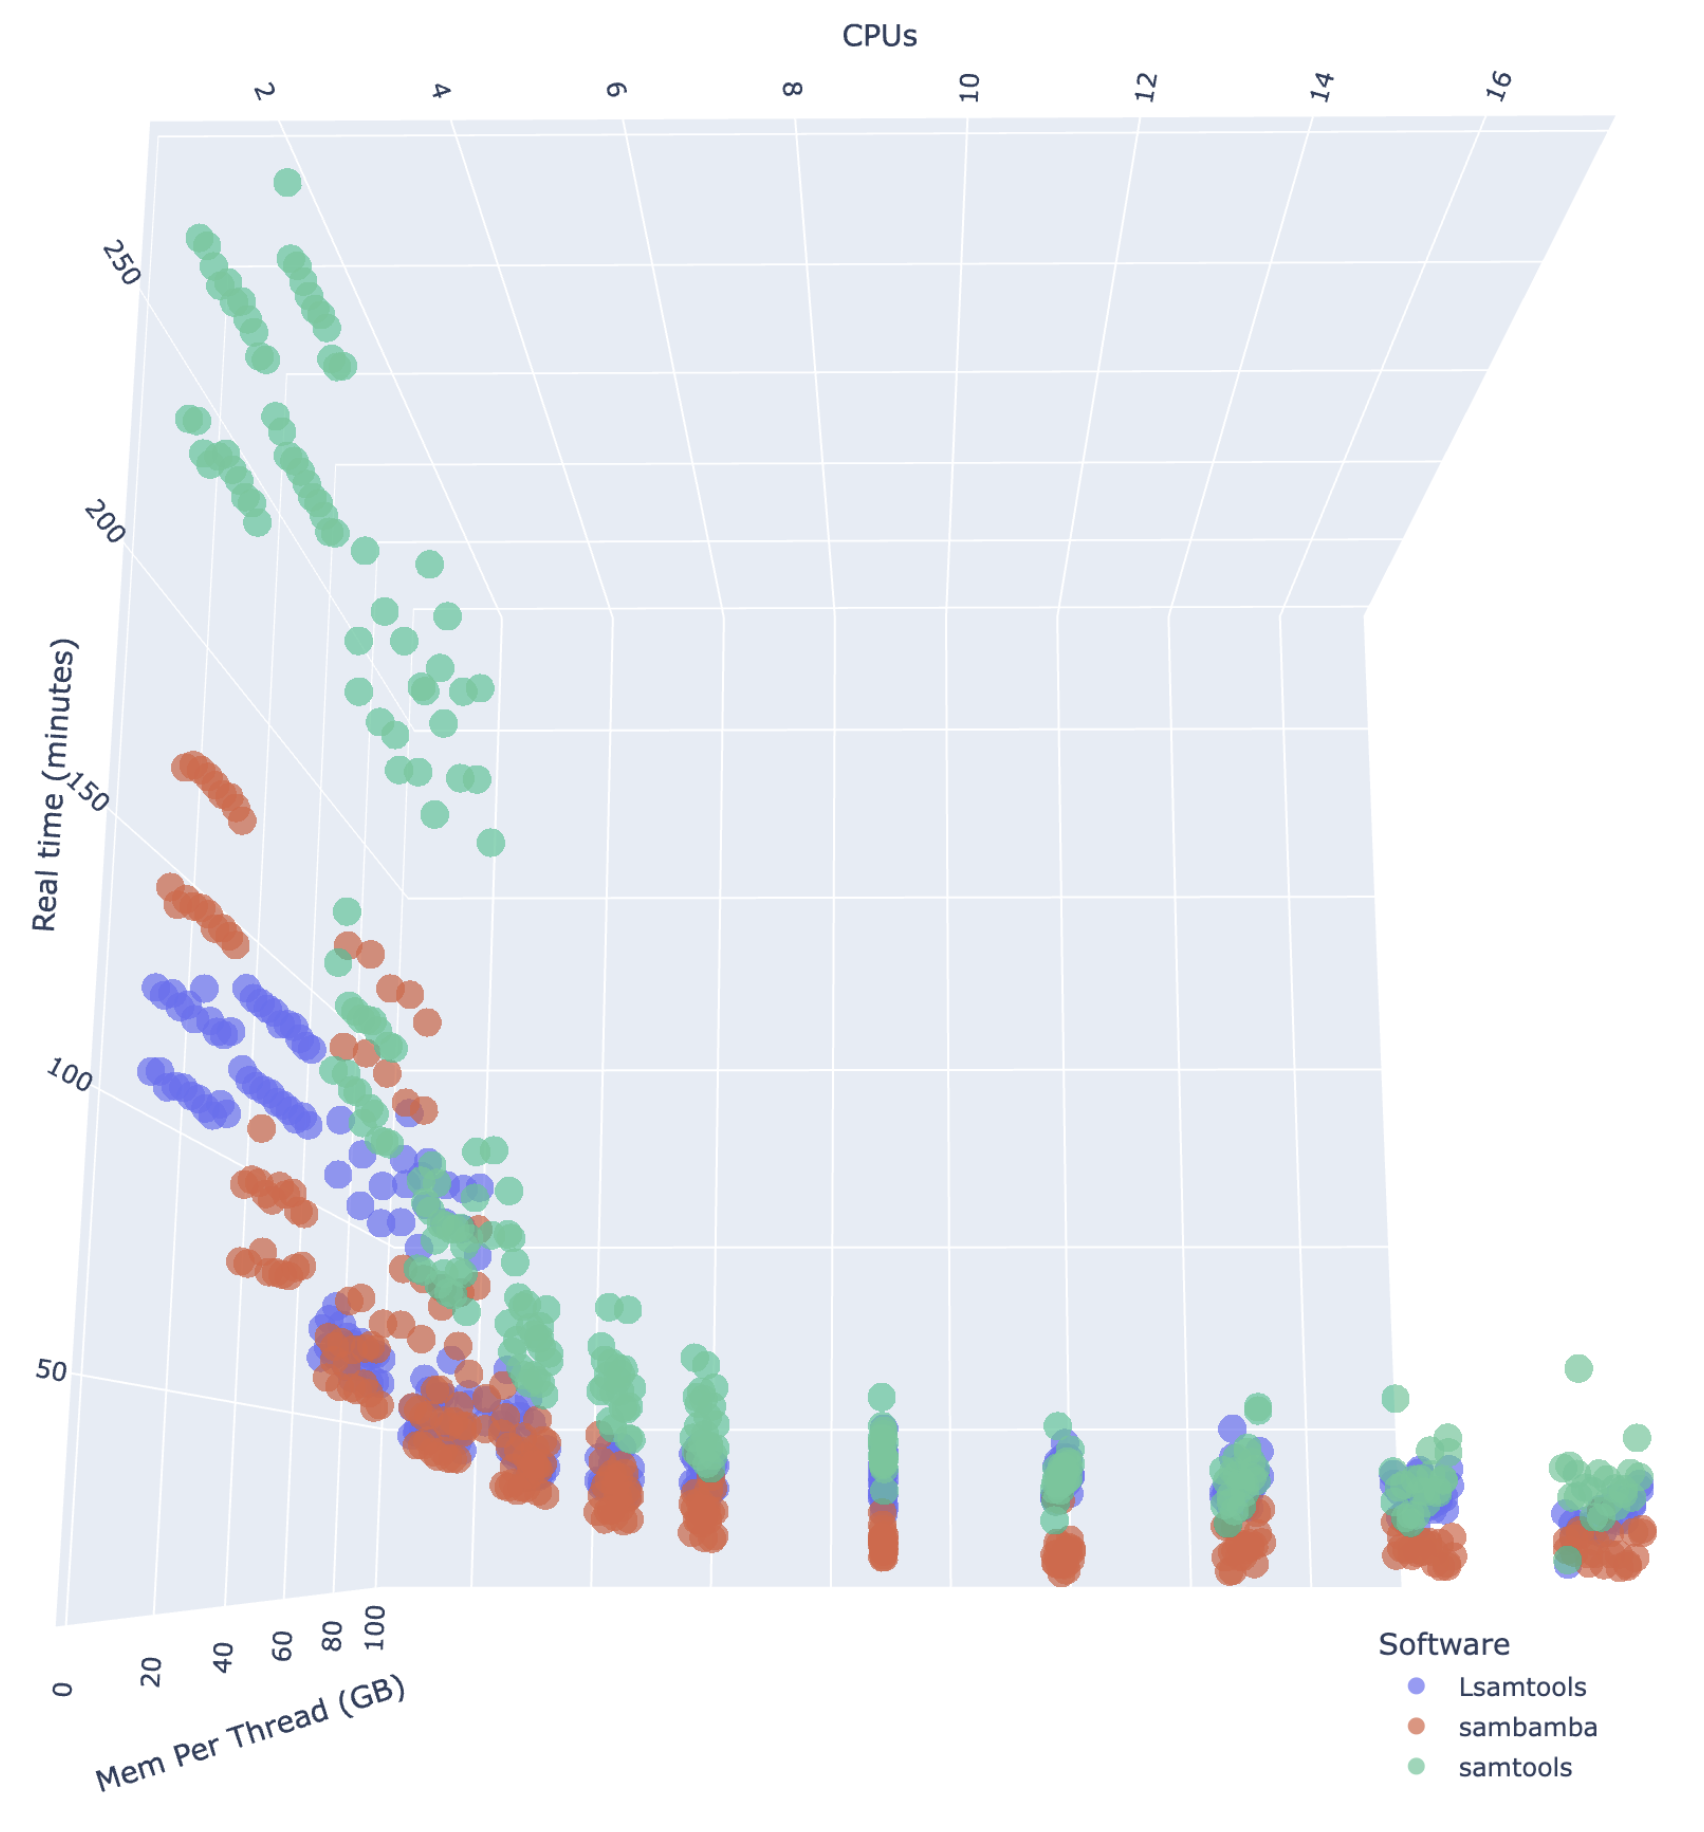
(Angle 2) Comparison between samtools + zlib, samtools + libdeflate (Lsamtools), and sambamba
Here, I'm showing that samtools + zlib and sambamba performance flattens out at ~11 CPUs (again, plot 3 below explans why).

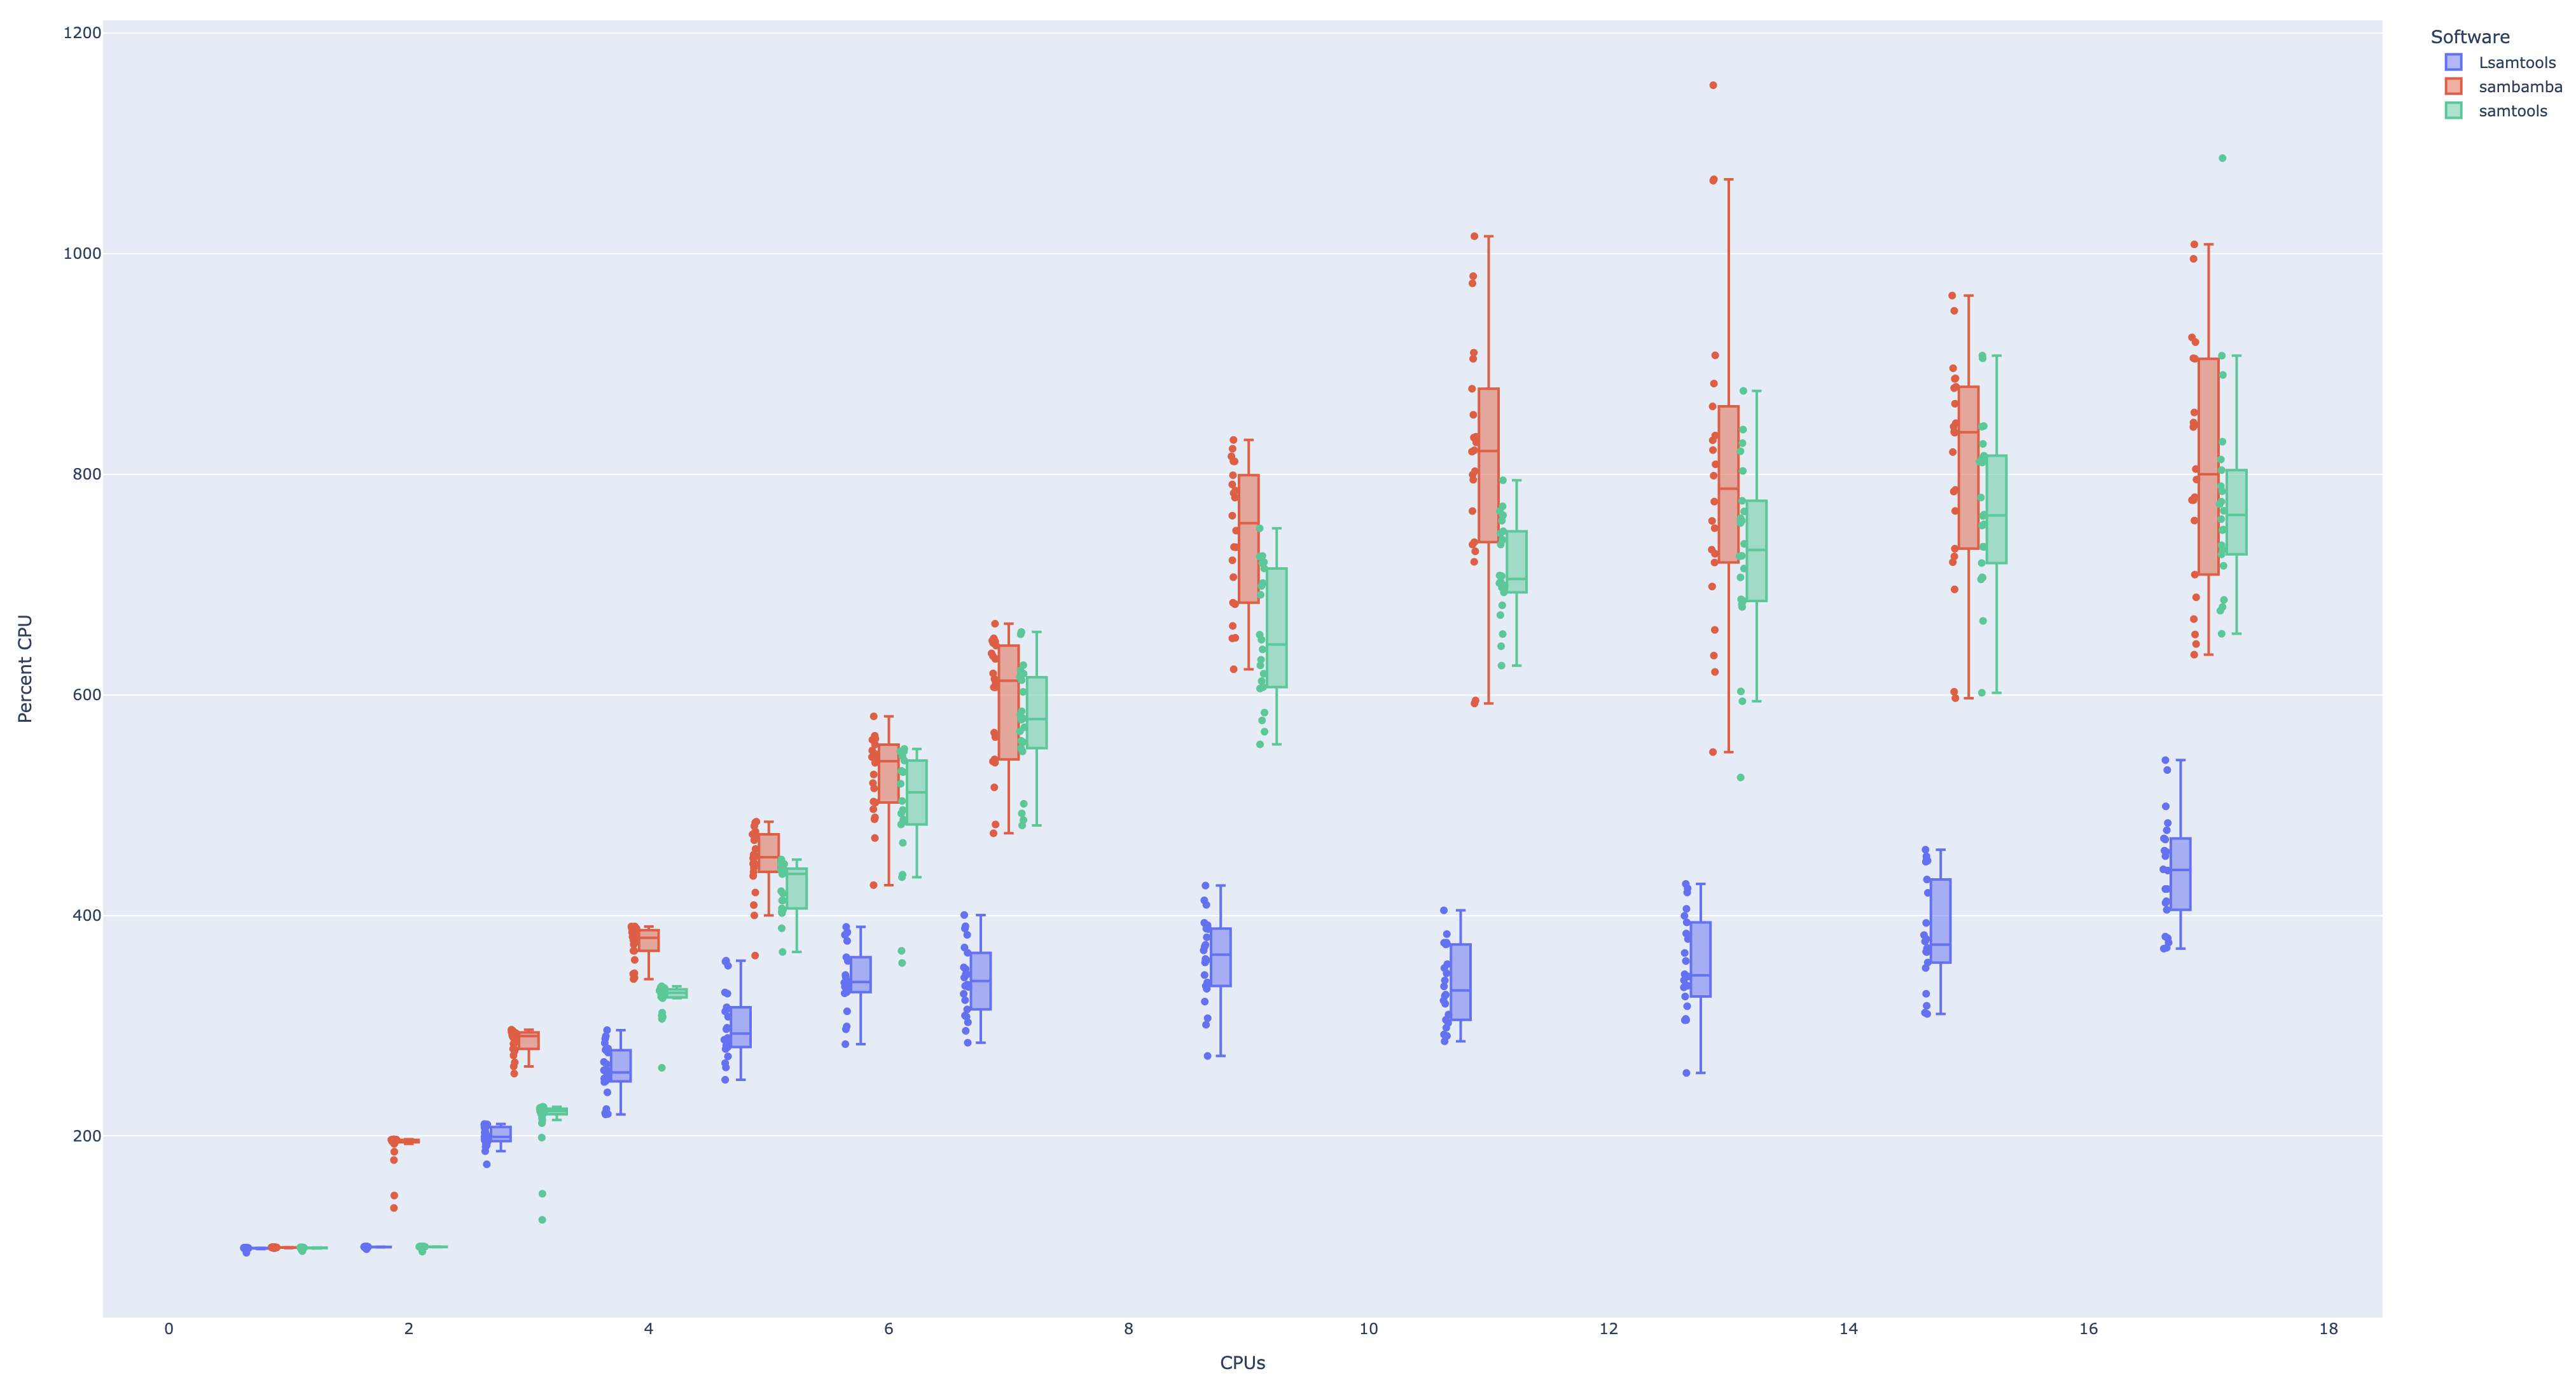
Requested CPUs vs. CPU utilization for samtools + zlib, samtools + libdeflate (Lsamtools), and sambamba
Here, I'm showing how well each tool is able to utilize the CPUs allotted to it. It was fascinating to see that samtools + libdeflate flattens out very early in it's CPU utilization (i.e., ~3 CPUS) and struggles to cross the 400% CPU utilization with even >10 CPUs. This is why samtools + libdeflate performance flattens out quickly.
samtools + zlib does a much better job utilizing allotted CPUs, but still lags behind sambamba throughout (and is slower, anyway).

Update 1

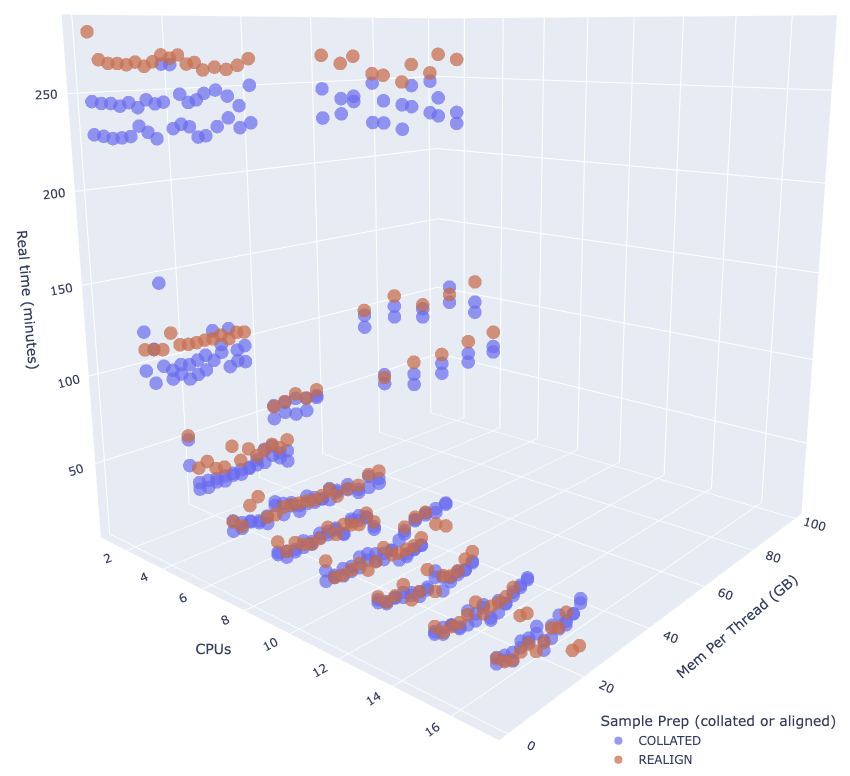
My first plots (below) were showing duration on the z-axis, which is the time from job submission to completion rather than job start to completion. That's why the larger memory requests were much longer in the original plots. Duration is still a useful measure, but I'm now including real time, which is from start to completion.
Judging solely by real time (above), there is a clear gain between 5 & 7 CPUs (~10 minutes, on average when compared to the same mem-per-thread).
More data coming, including samtools compiled against libdeflate and sambamba.
Original post
I made time to semi-formally look at this. I'm glad I did because the results surprised me. I don't answer all of my questions directly, but these results are good enough to get me going in the right direction.
My code and results are in my GitHub repository (Samtools_sort_optimization_test) where you will also find an interactive plot you can download to see the results more clearly (see SAMTOOLS_SORT/samtools_sort_CPU_and_memory_comparison.tar.gz in the repository). It's hard to truly appreciate the 3D plotly plot until you start rotating it.
NOTES:
- Even though this is from only three samples, I think my results are accurate. I welcome any feedback in case there's a bug.
- In my experience,
samtools often exceeds its allotted memory (at least on a SLURM scheduler). i.e., the job gets killed by SLURM. To avoid this, I requested an additional 20% of memory to provide a buffer for samtools. I don't know if this discrepancy is because of SLURM or samtools, though.
- These results are using
samtools compiled against zlib. We are preparing a version of samtools compiled against libdeflate, per @user172818's suggestion. I will add those results once completed. I may also compare against sambamba, per @acvill's suggestion.
- These results are related to my other question about the best sorting/merging method. I will post those results in that question and provide a brief summary here.
tl;dr (too long, didn't read)
Primary conclusions based on the plots below
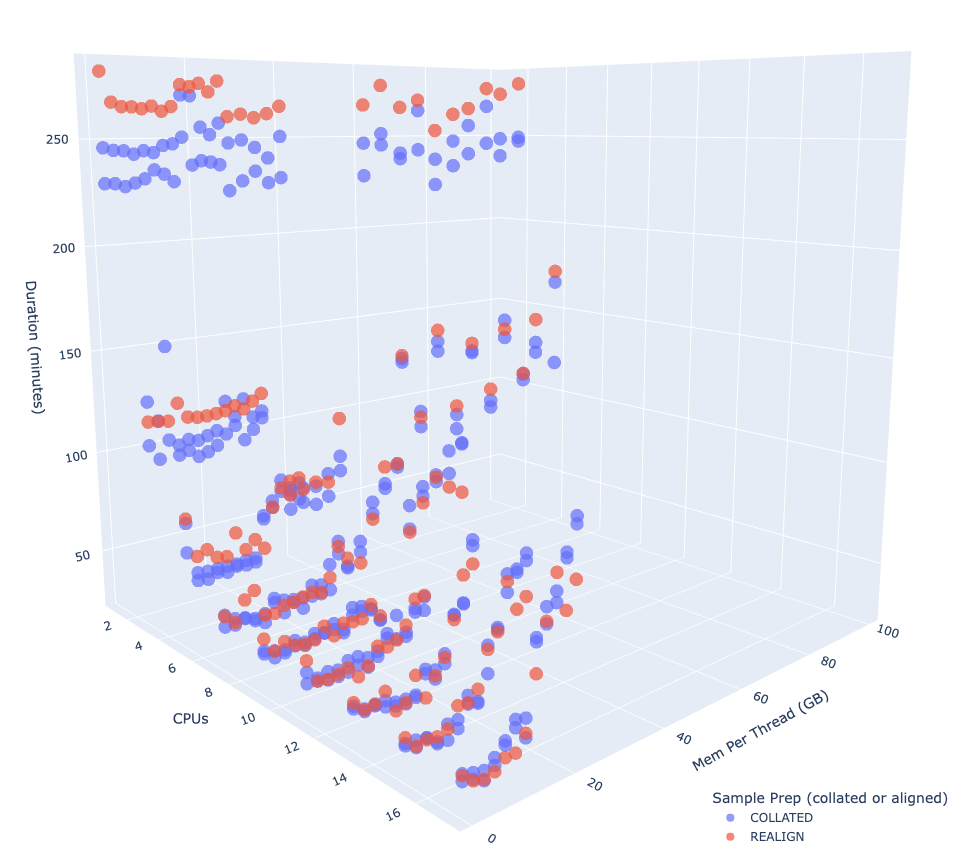
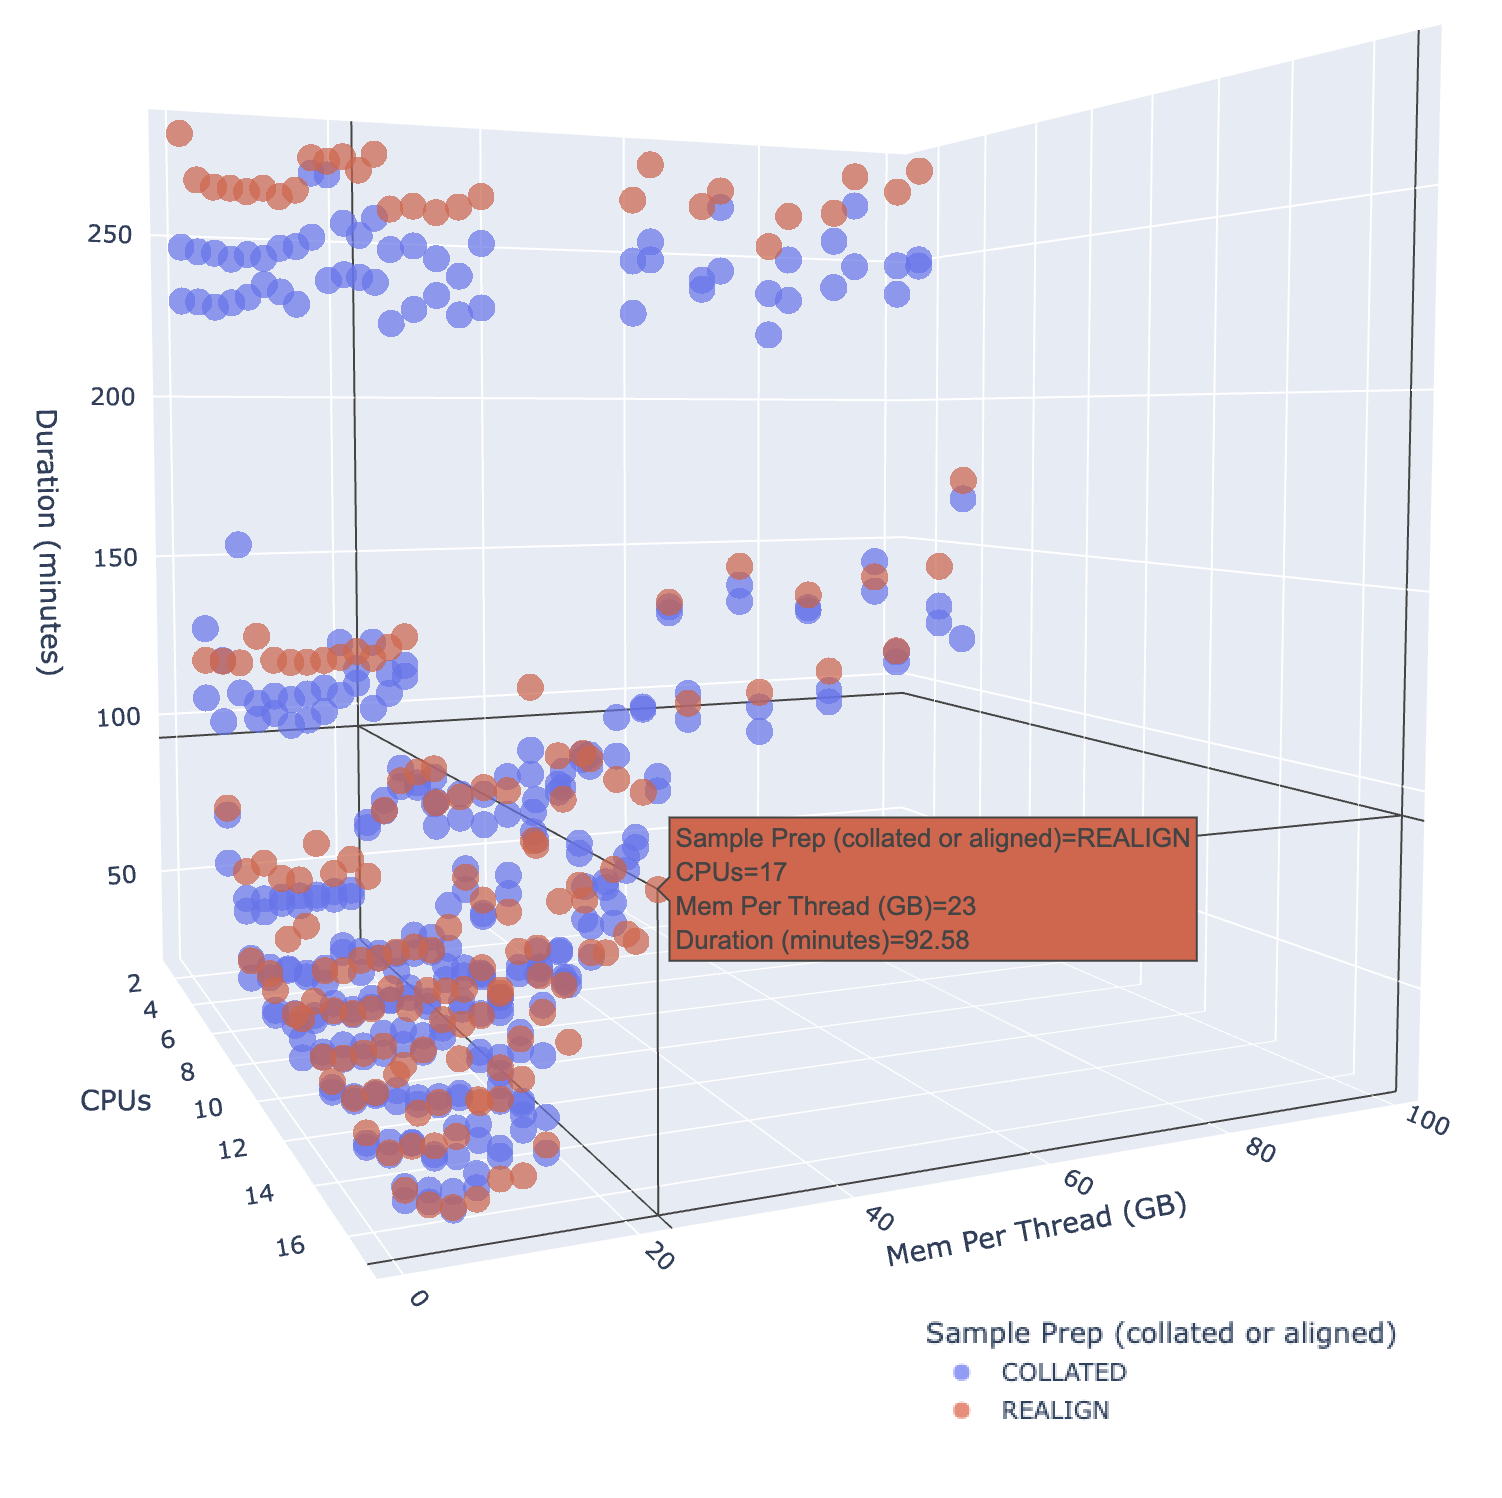
- Optimal CPUs (results as expected): There's a significant gain with some additional CPUs, but it levels off around 7 CPUs (total, not 'additional'; i.e.,
samtools sort -@ 6). I thought we might still see some nice gains above 7, but this is probably what most would expect (e.g., similar to what @user172818 suggested).
- Optimal memory per thread (
results NOT as expected): There is very little to gain with more than 1GB of memory (per thread); that surprised me. There are some performance gains up until ~7GB per thread (~2-4 minutes faster). What really surprised me, however, is that performance dramatically decreases as memory per thread goes >7GB. The updated plot (above) shows there is some gain with >1GB mem per thread. When running lots of samples at once (hundreds to 1000), mem per thread seems to play a much larger role (data coming).
- Effect from sorting status (results as expected): Largely in an attempt to do this as quickly as possible (laziness?), I used three samples, where one was from an aligned and unsorted
.bam file, and the other two were from .bam files that had been aligned and sorted, but I then collated them (samtools collate), rather than re-aligning them. Unsurprisingly, the collated samples (not the average use case) sorted slightly faster than the
unsorted sample (average use case).
Initial opinion
- "Small" sample set: For a small sample set, I would probably use 7 total CPUs and 7GB per thread.
- "Large" sample set: I will probably use 7 CPUs (maybe 5) with only 1GB memory per thread. That will allow the scheduler to keep as many jobs going as possible.
samtools sort: duration vs. CPUs and mem per thread
As mentioned above, an interactive version of this plot is available on my GitHub.
Angle 1

Angle 2

Additional details
Analyses were run on University of Kentucky's MCC Cluster, which uses AMD 7702P processors, using samtools v.1.14
