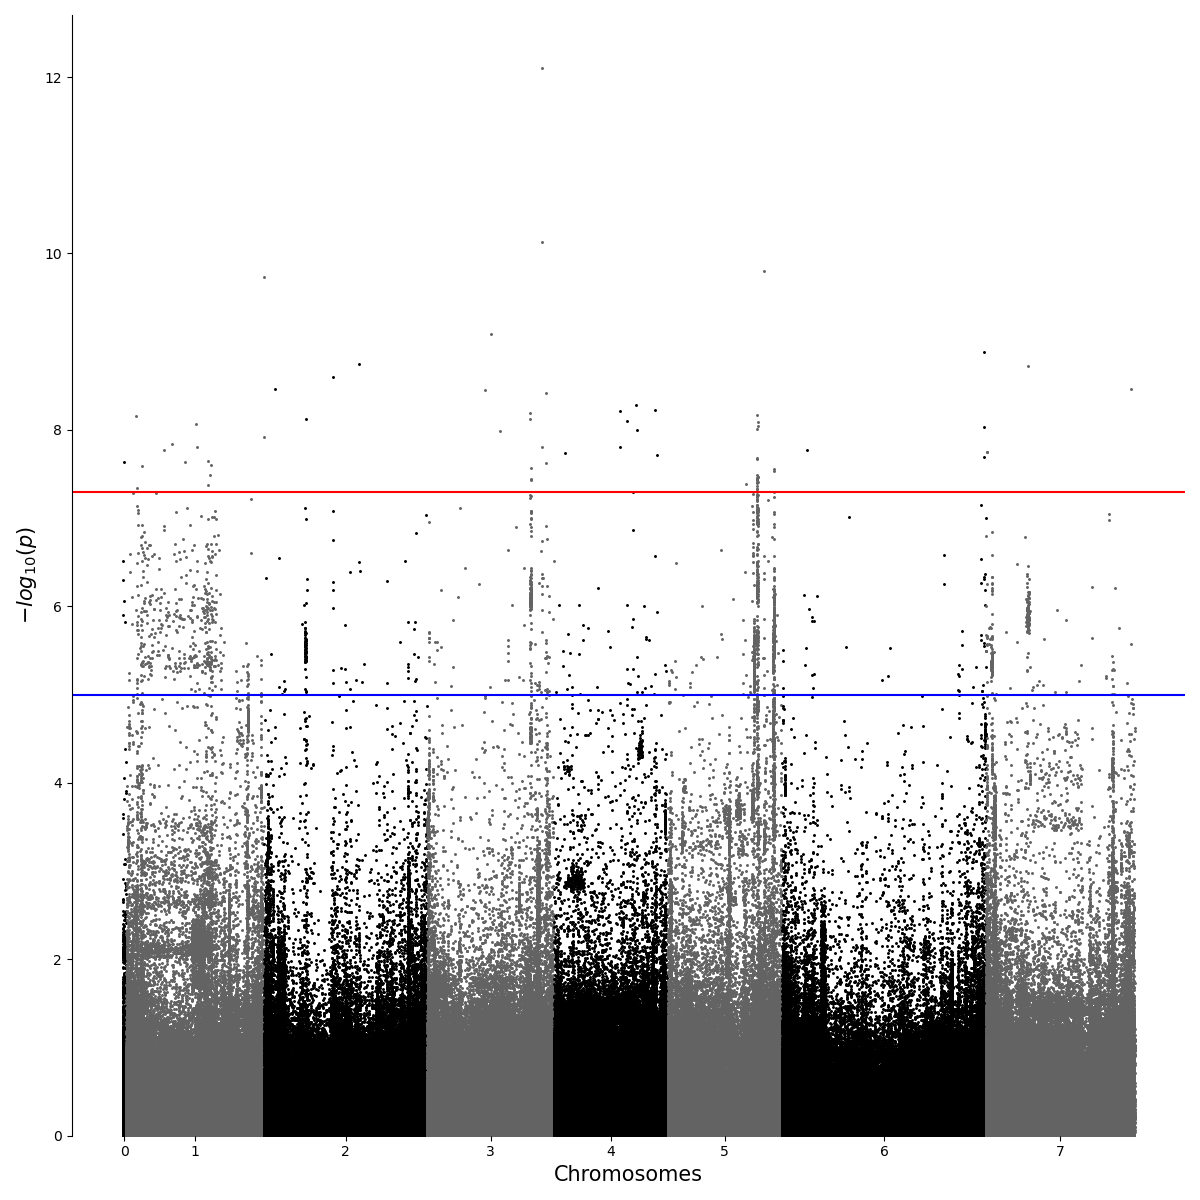
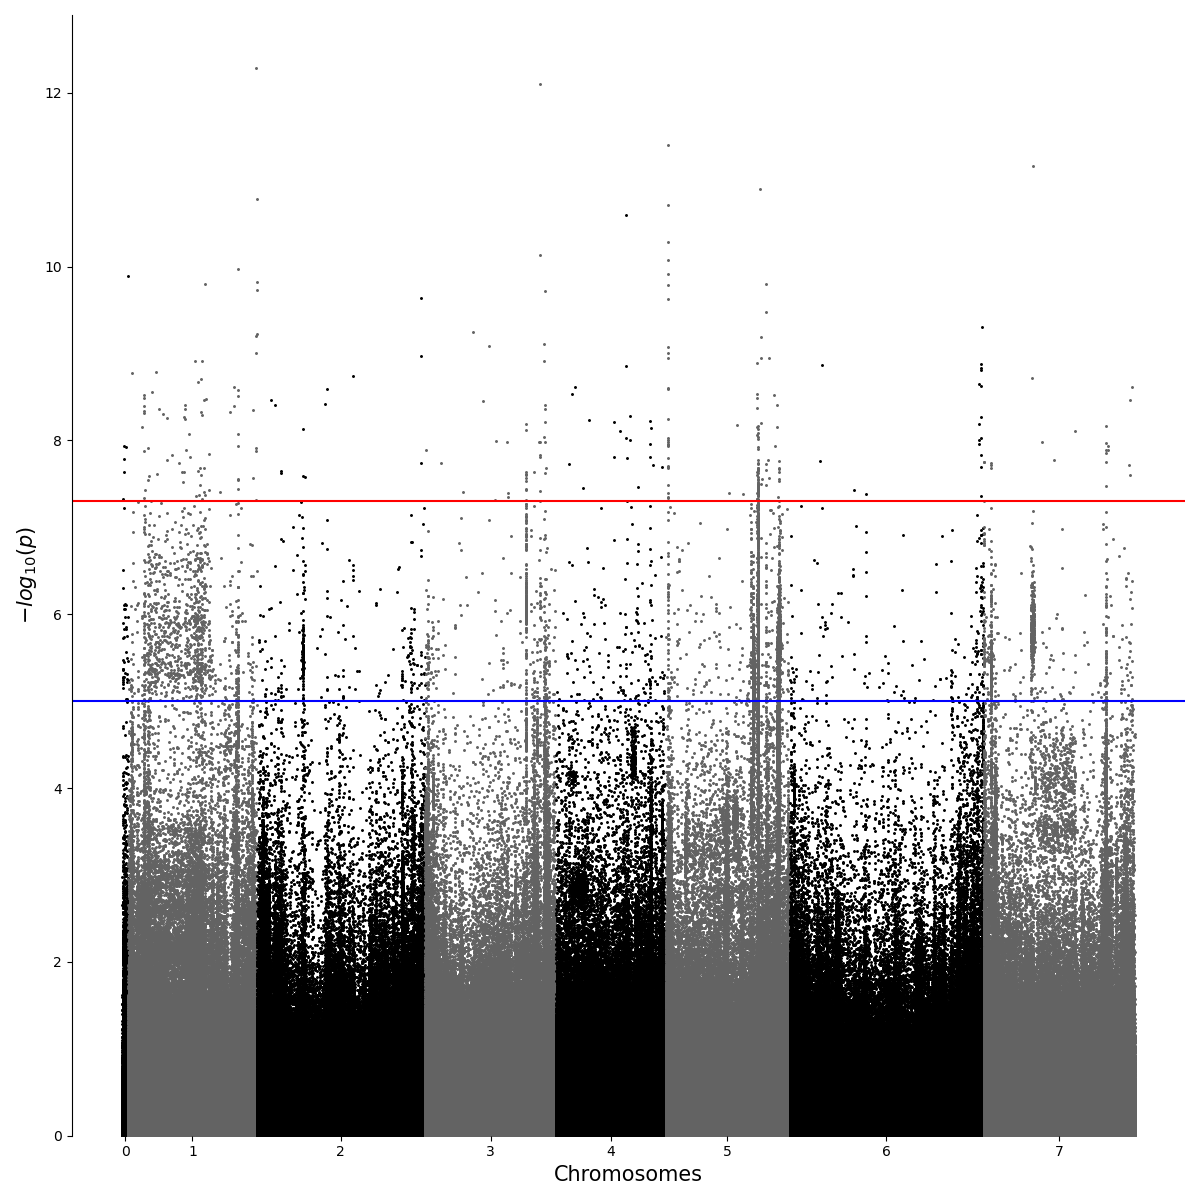
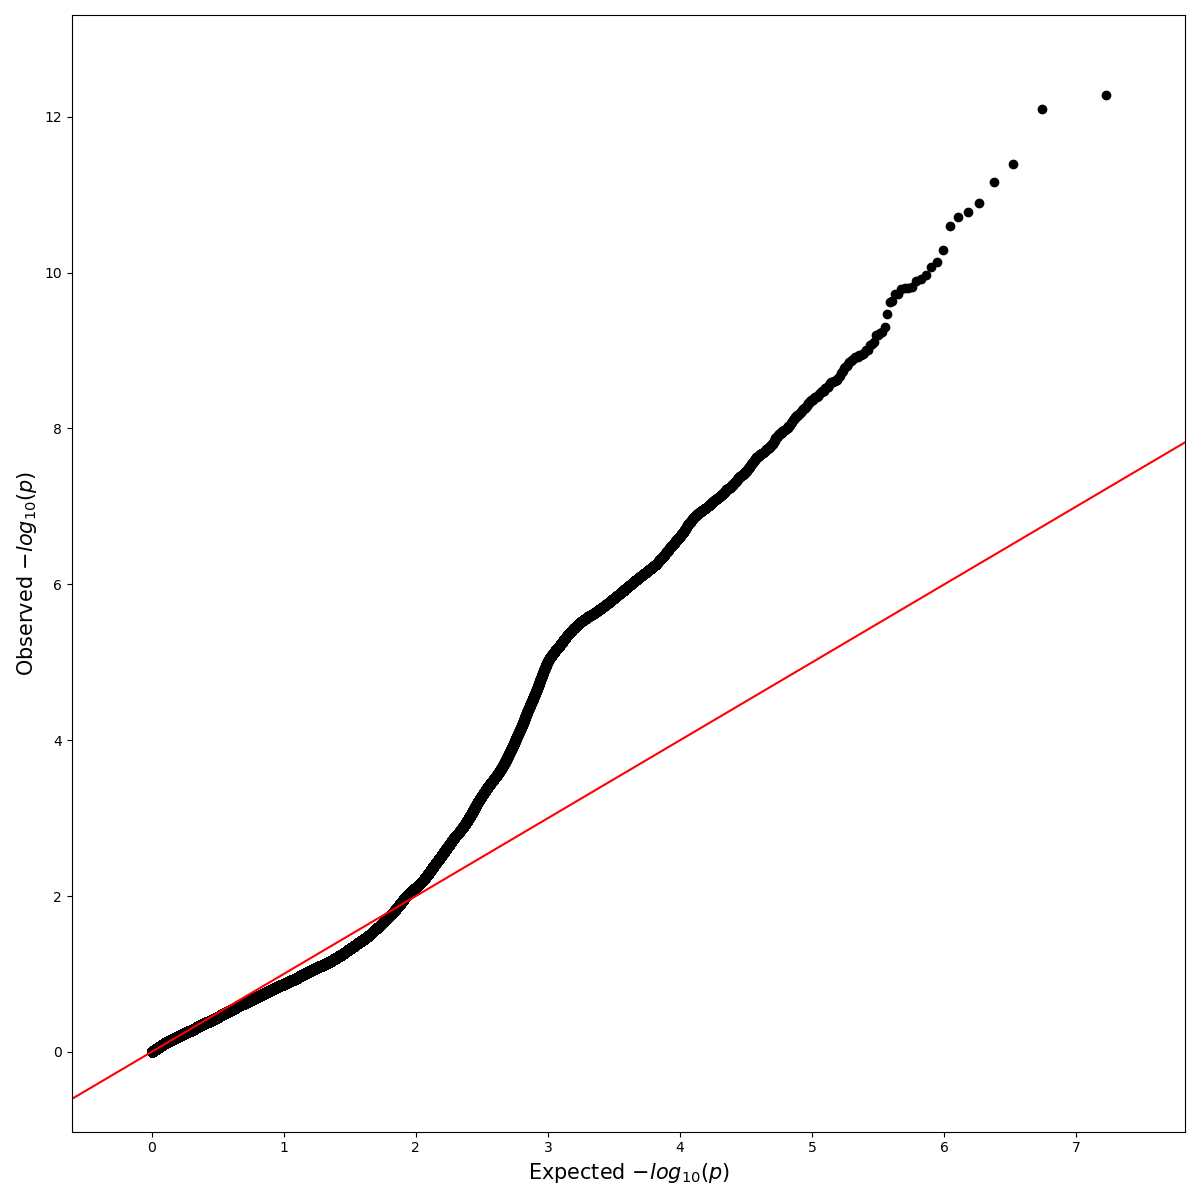
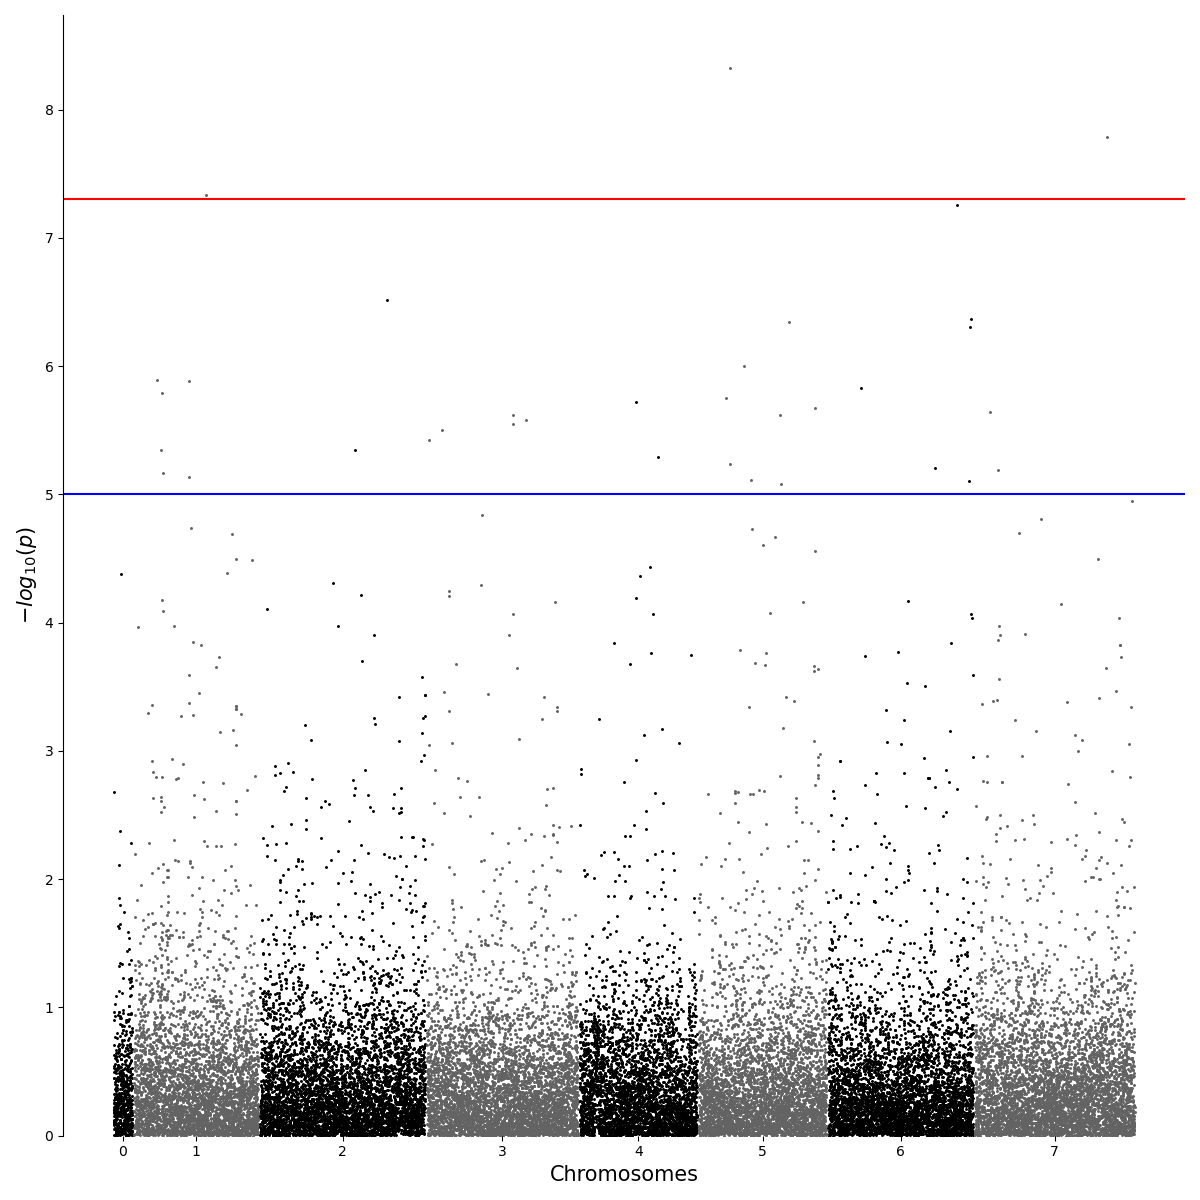
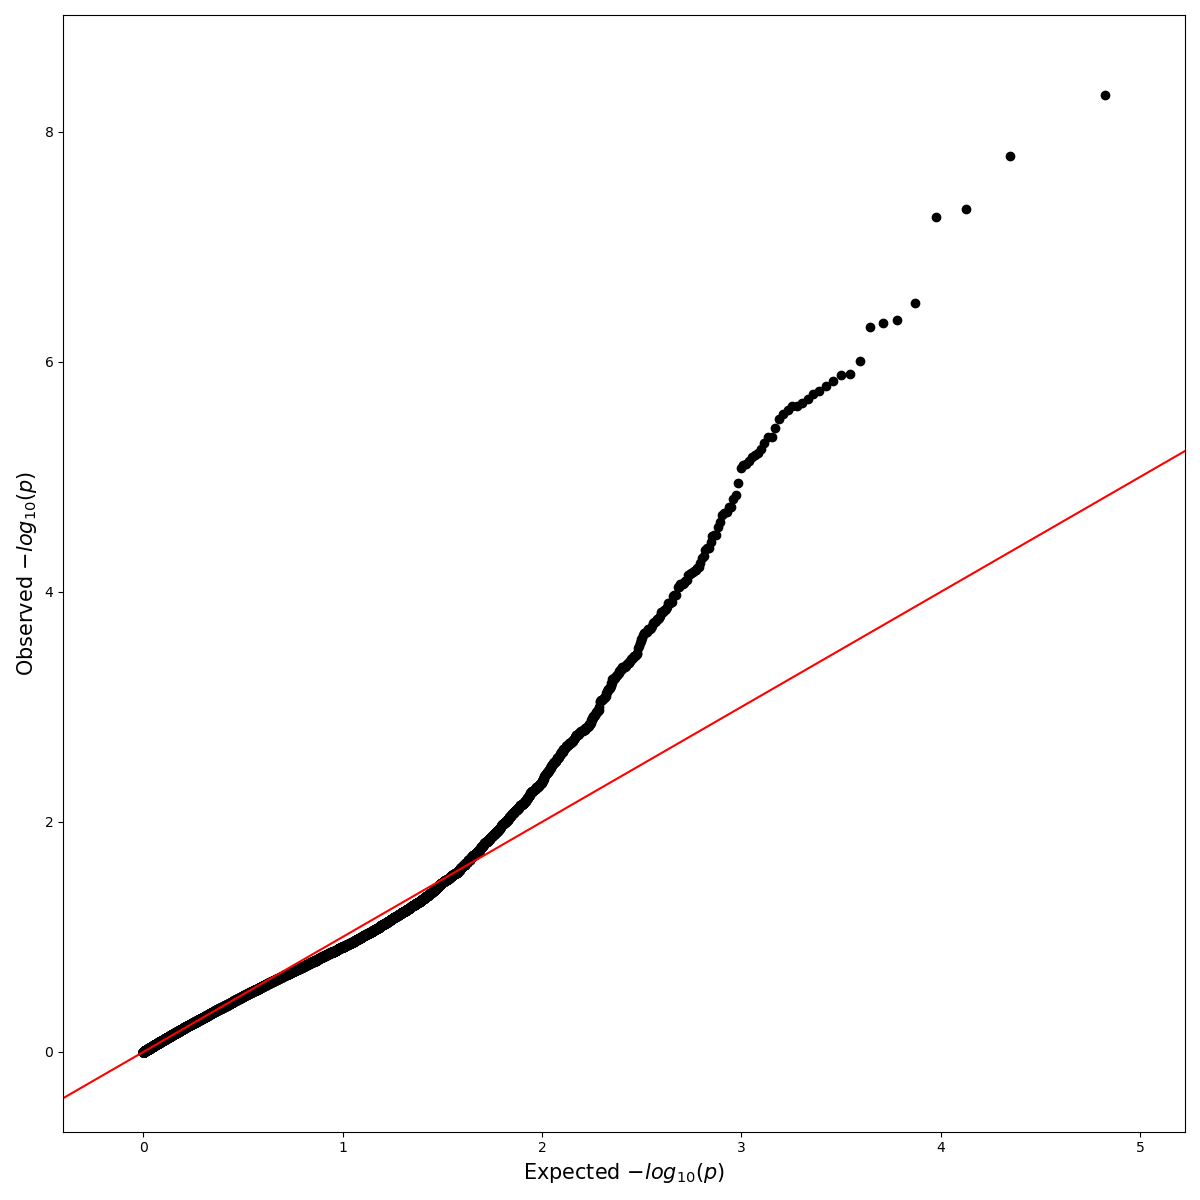
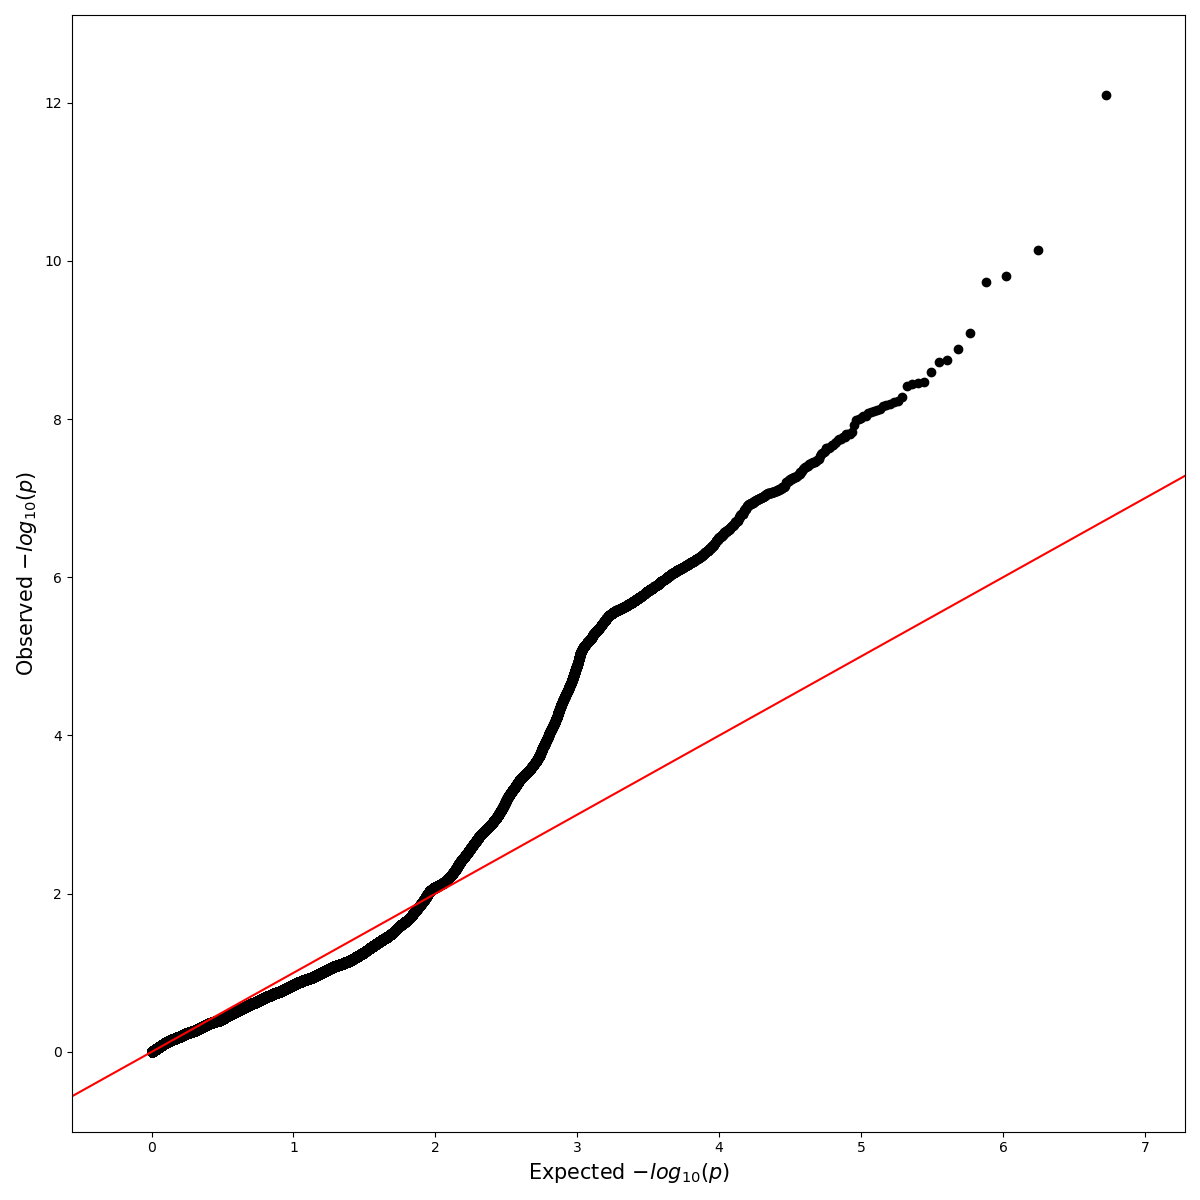
Based on the QQ plots, filter out variants with p > 0.01, then display the beta statistic (or whatever other statistic you're using to demonstrate association). If you want to incorporate the p-value in the displayed results, show the minimum test statistic from a 95% confidence interval. Here's an attempt I made at doing that with some GWAS summary statistics relating to household income (something that wouldn't be expected to have a heritable component):
https://twitter.com/gringene_bio/status/1207617723586371584
After looking at the test statistic, you may be able to make better decisions about thresholding with the other values. One thing you could try is to incorporate those values into a scatter plot that shows more than two dimensions. The other statistics could be represented as size, colour, or Z location on a 3D scatter plot.
P-values should not be overemphasised, used for ranking, or displayed on their own. See the American Statistical Association's report on the p-value for more information:
https://amstat.tandfonline.com/doi/full/10.1080/00031305.2016.1154108#_i30
As far as I'm aware, the p-values as calculated by GWAS software represent uncertainty in the test statistic (i.e. t, or beta), and not the probability of association. If you want to calculate that association probability, carry out bootstrap sub-sampling of the individuals and then determine the proportion of sub-samples in which the tested variant appears in, say, the highest 5% of variants, ranked by the test statistic. Instead of filtering on HWE, MAF and MCR, you could try filtering on the bootstrap proportion instead, which should incorporate all statistics that introduce uncertainty into the dataset.
More details and figures can be found on this poster:
https://f1000research.com/posters/5-2190
If you're going to be generating a PCA on these data, please consider labelling the cases and controls (or low/high for quantitative traits) on the PCA to verify that the groups look similar in terms of overall population structure. Hopefully you won't find any blobs in the PCA that have only one of the two groups in them, but if you do, they should be dealt with first. Any differences in population structure (even very small, subtle differences) will dominate the GWAS results because structure-associated signal will cover a huge region of the genome in comparison to effects from a few (or a few hundred) SNPs. Here are some papers I've found insightful regarding this issue:
