Background
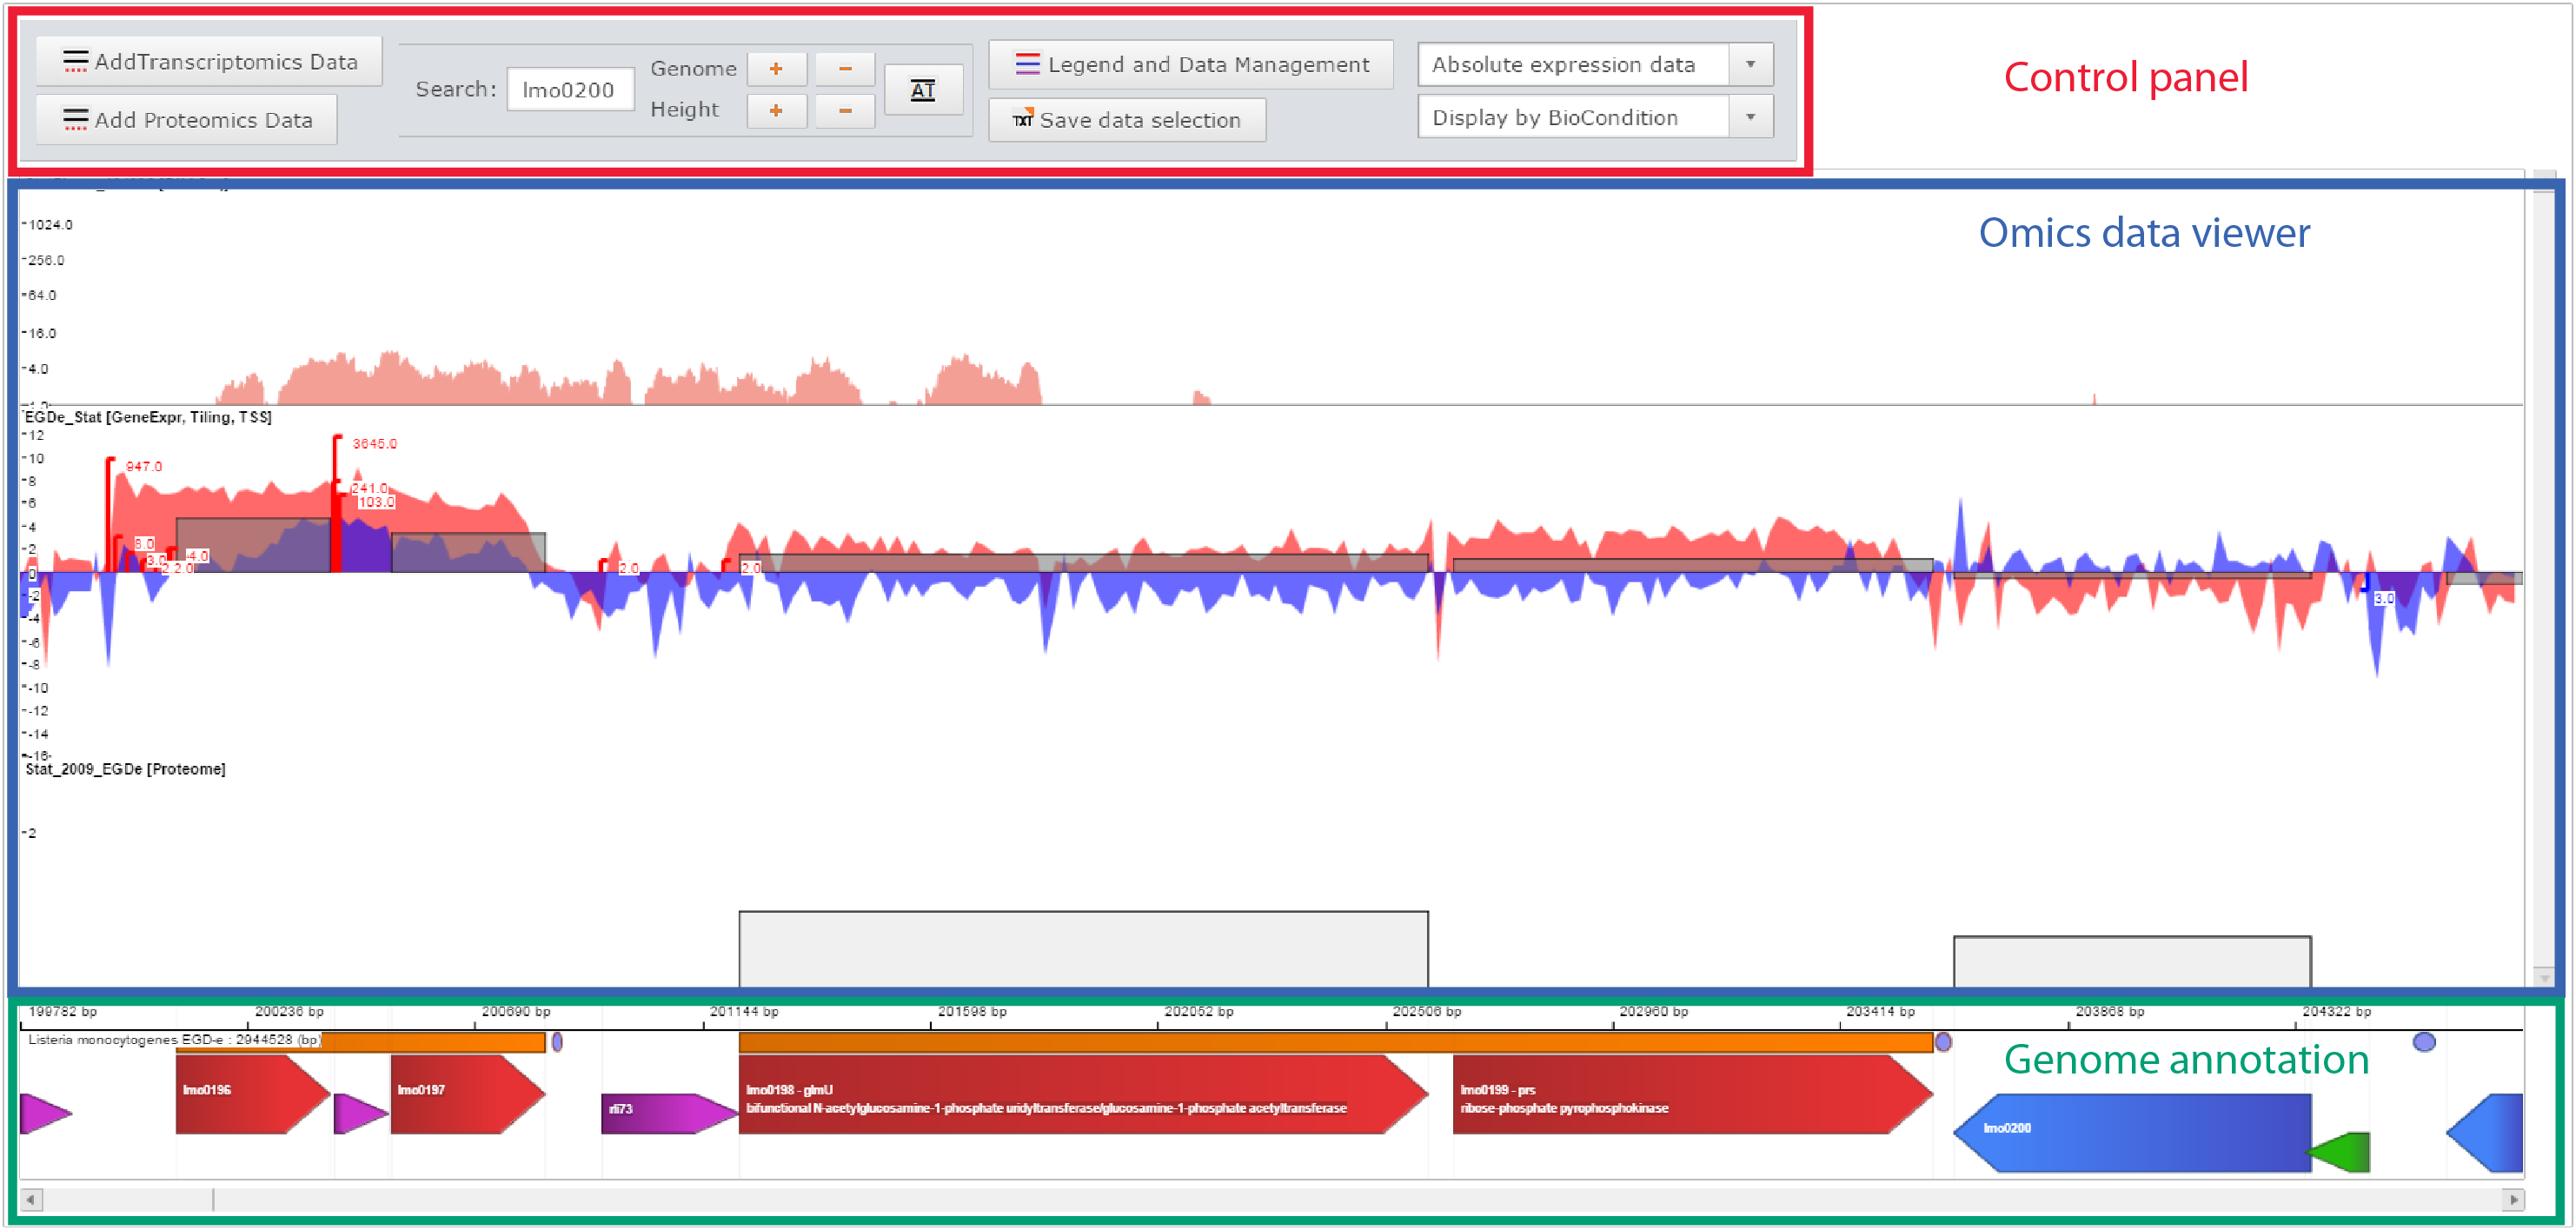
We want to be able to load (or request) data for a genome including the sequence and gene annotation (bacteria). Then, we want to load our own annotation which should be displayed as a line plot:
position score
1        5
2        6
etc.
Where each position corresponds to the position in the genome (i.e. FASTA). Something like this:
Question
Is there a tool that can load a genome sequence, gene annotation, and a position ~ score file, which can be displayed as a line plot?
