I have a matrix data with cells as rows and samples as columns. Here I am giving the data with dput
dput(data)

structure(c(0, 0, 0.0095, 0.0091, 0, 0.0195, 0, 0.006, 0.0023,
0.0035, 0, 0.0306, 0, 0.0859, 0, 0, 0.0059, 0.0229, 0, 5e-04,
0, 0.0116, 0.0173, 0.0076, 0.0133, 0.0344, 0, 0.1263, 0, 0, 0.0378,
0, 0, 0.0198, 0, 0.0268, 0, 0, 0.0044, 0.0607, 0, 0.0073, 0,
0.1343, 0.0016, 0.0864, 0, 0, 0, 0.0296, 0.0122, 0.0329, 0.0204,
0.0582, 0, 0, 0.003, 0.1011, 0, 0, 0, 0, 0.0124, 0.0013, 0, 0.0025,
0.0076, 0.0498, 0, 0.0103, 2e-04, 0.0562, 0.0673, 0.069, 0, 0.0297,
0, 0.0207, 0.0329, 0.0072, 0.0028, 0.0589, 0.0533, 0.0139, 0,
0.0791, 0.0361, 0.026, 0, 0.0036, 0, 0.0319, 0.0155, 0.0401,
0.064, 0.0743, 0.0026, 0.012, 0, 0.0089, 0.0468, 0.0994, 0, 0.0646,
0, 0.0391, 0.0209, 0.0051, 0.007, 0.0689, 0, 0.0218, 0, 0, 0.0157,
0, 0, 0.0119, 0, 0.0136, 0, 0.0036, 0.0016, 0.0583, 0, 0, 0.0031,
0.2211, 0.6257, 0, 4e-04, 0.173, 0.0557, 0.1104, 0.0288, 0.0474,
0, 0.0078, 0.0914, 0.0289, 0.0293, 0.1067, 0, 0.0121, 0, 0, 0.018,
0, 0.021, 0.039, 0.0146, 0.043, 0.0367, 0.0245, 0, 0, 0, 0, 0,
0.0097, 0, 0.003, 0.0072, 0.017, 0.0061, 0.0453, 0, 0.0587, 0,
0, 0.1009, 0.0231, 0, 0.0279, 0, 0.048, 0.01, 0, 0.0083, 0.0355,
0, 0.1058, 0, 0, 0.0634, 0.0138, 0, 0.0116, 0, 0.0683, 0, 0,
0.0229, 0.064, 0, 0, 0, 0, 0.0222, 0.005, 0, 0.0176, 0, 0.0291,
0.0017, 0.008, 0.003, 0.0693, 0, 0.0156, 0.0038, 0.0577, 0, 0,
0, 0, 0.0521, 0, 0, 0.0017, 0, 0.0218, 0.1336, 0, 0, 0, 0, 0,
0, 0.0398, 0, 0.0099, 9e-04, 0.0046, 0.0055, 0.0361, 0.0382,
0.0168), .Dim = c(14L, 17L), .Dimnames = list(c("Cell1", "Cell2",
"Cell3", "Cell4", "Cell5", "Cell6", "Cell7", "Cell8", "Cell9",
"Cell10", "Cell11", "Cell12", "Cell13", "Cell14"), c("Sample1",
"Sample2", "Sample3", "Sample4", "Sample5", "Sample6", "Sample7",
"Sample8", "Sample9", "Sample10", "Sample11", "Sample12", "Sample13",
"Sample14", "Sample15", "Sample16", "Sample17")))
Annotation of samples is in a dataframe df look likes this:
dput(df)

structure(list(Samples = c("Sample2", "Sample6", "Sample7", "Sample8",
"Sample9", "Sample10", "Sample11", "Sample16", "Sample17", "Sample1",
"Sample3", "Sample4", "Sample5", "Sample12", "Sample13", "Sample14",
"Sample15"), Group = c("A", "A", "A", "A", "A", "A", "A", "A",
"A", "B", "B", "B", "B", "B", "B", "B", "B")), row.names = c(NA,
-17L), class = c("tbl_df", "tbl", "data.frame"))
Using the above data and annotation with below code I made a heatmap:
#Associated libraries
library(ComplexHeatmap)
library(RcolorBrewer)
library(circlize)

#Set annotation
ann <- data.frame(df$Group)
colnames(ann) <- c("Group")
colours <- list("Group"=c("A"="orange","B"="darkgreen"))
colAnn <- HeatmapAnnotation(df=ann, which="col", col=colours, annotation_width=unit(c(1, 4), "cm"), gap=unit(1, "mm"))

myCol <- colorRampPalette(c("#ffffff","#0030dd", "#3259e3", "#7f97ee"))(100)
myBreaks <- seq(0,1, length=100)
hmap <- Heatmap(data, name = "xCell scores", col = colorRamp2(myBreaks, myCol),
                width = unit(100, "mm"),show_row_names = TRUE, show_column_names = FALSE, cluster_rows = FALSE,
                cluster_columns = FALSE, show_column_dend = FALSE, show_row_dend = FALSE,
                row_dend_reorder = FALSE, column_dend_reorder = FALSE, clustering_method_rows = "ward.D2",
                top_annotation=colAnn)
draw(hmap,heatmap_legend_side="right", annotation_legend_side="right")
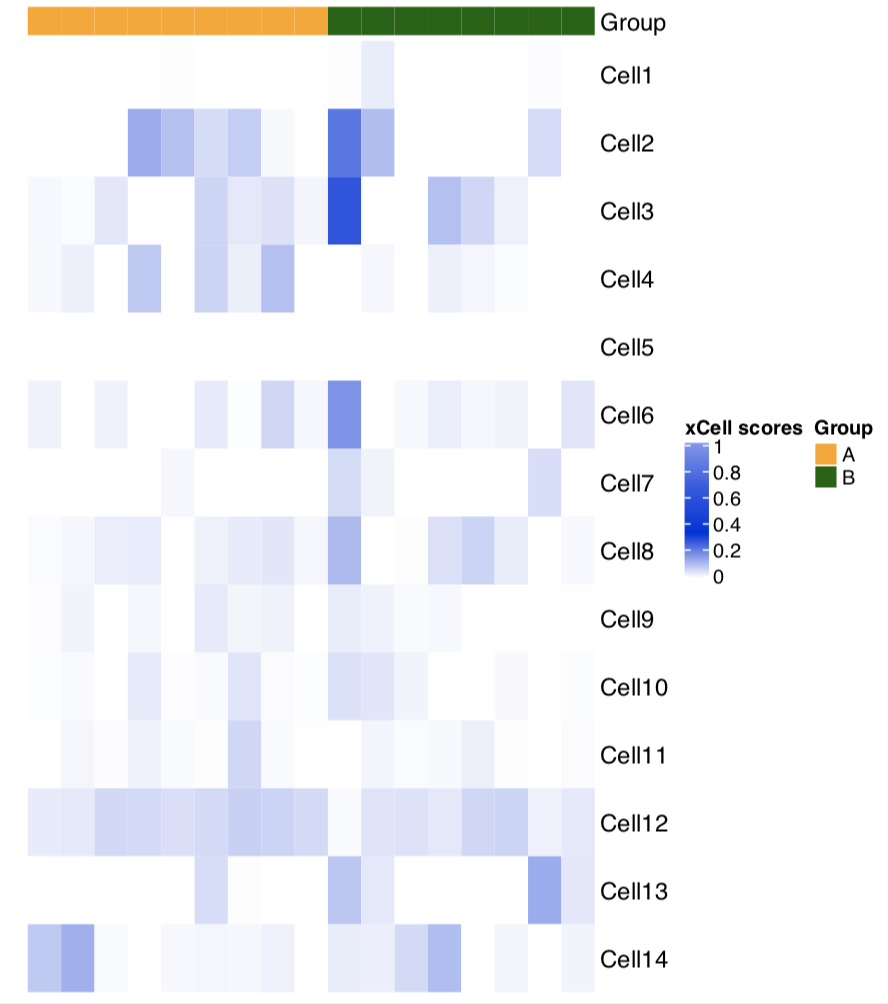
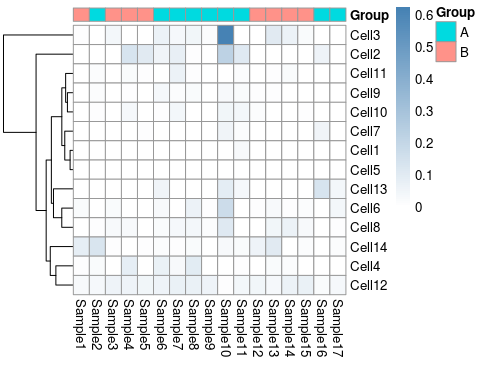
The heatmap looks like this:
But I want to sort the rows (cell1 to cell14) keeping the cell4 (interested cell) on the top and also keep the samples with values (coloured in blue in heatmap) together and samples with 0 values (white coloured) following that.
It should look something like the below heatmap which is from the Figure 4a in this research paper 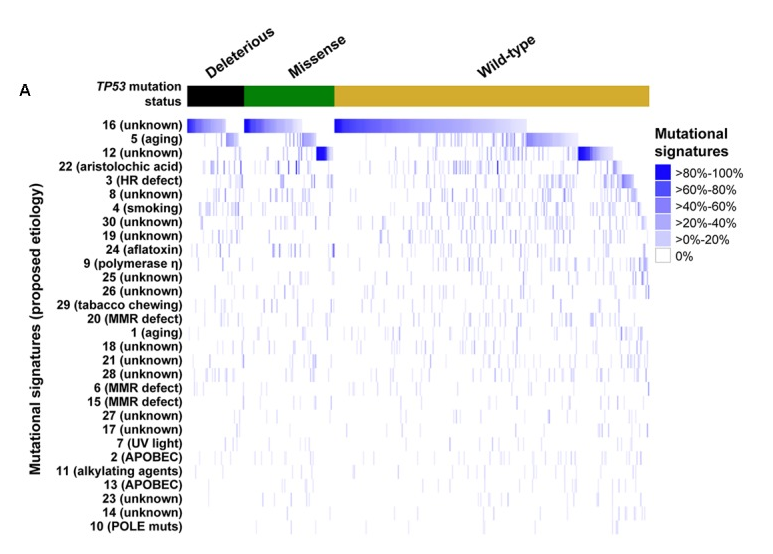
As you see in this heatmap all the coloured samples are together.
This must be done with some sorting and using transform, but not able to make it.
Any help is appreciated. thank you in advance.
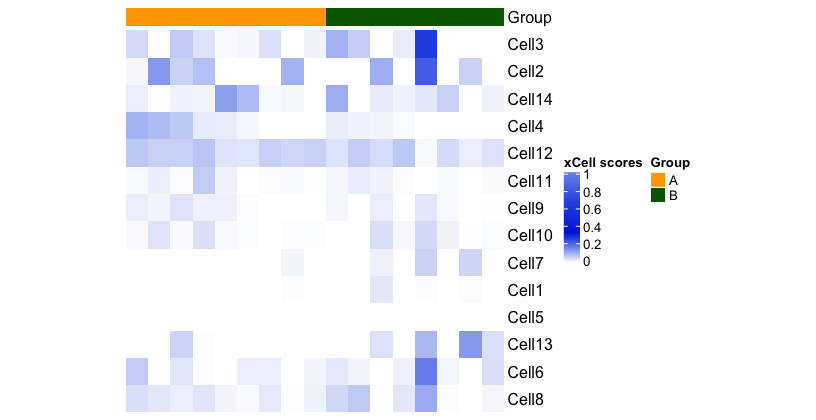
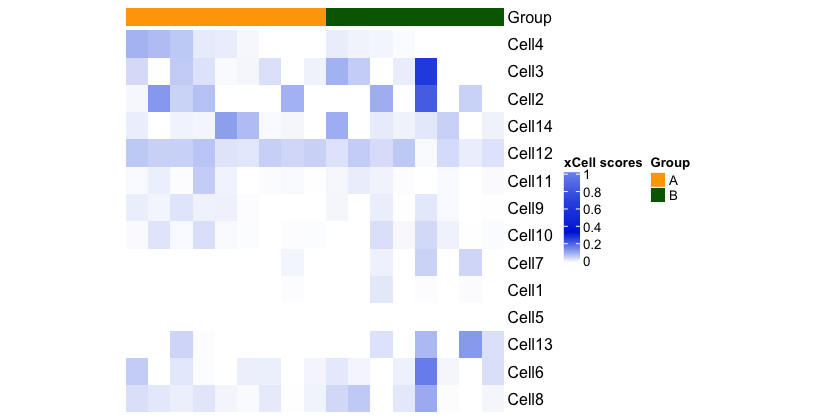
Heatmapfunction with argumentcolumn_order = vector, where vector is this new order. $\endgroup$orderfunction. $\endgroup$