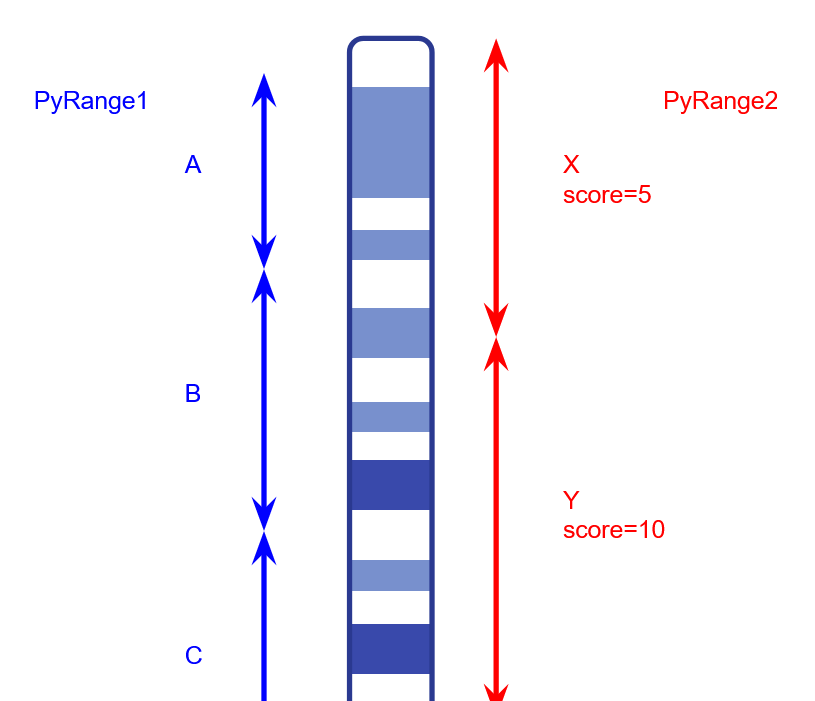
I have two PyRanges objects. PR1 is a set of regions of interest across a chromosome, PR2 tiles the genome and has a score associated with each range.
I need a way to get for each range in PR1 its score based on its overlap with PR2. If it is contained within just one range in PR2, it inherits the score of that range. If it overlaps multiple ranges on PR2, the score should be a weighted average of those ranges based on the size of the overlap.
Applying this to the image above, it would be:
score(A) = score(X)
score(B) = (OverlapBX * score(X) + OverlapBY * score(Y)) / sizeB
I've been browsing the PyRanges docs and I see a lot of functions that do almost that, but most of them don't take into account a score.
I had done this before in R using GRanges, where I could iterate over the overlap object to piece together scores, but I can't find a direct port of R's findOverlaps() in PyRanges.
The inputs I'm using for this are a list of mutation positions and a map of recombination rates over the chromosome they're on. So if two mutations are in a section with a constant recombination rate, the section between them inherits that recombination rate, but if the map says there's different rates between them, I need to take that into account.
Here's a pastebin with the data I'm working with: https://pastebin.com/sBYsjRQB
The Unfun Cat's first suggestion:
dist_to_pos = distances.join(positions, report_overlap=True).drop(like="_b")
df = dist_to_pos.df
g = df.groupby("Id2")
avg_score = g.cMperMb.sum() / g.Overlap.first()
avg_score.name = "AvgScore"
j_with_avg_score = pr.PyRanges(df.set_index("Id2").join(avg_score))
The results this give are... curious. Here's what it gives when applied to my data:
j_with_avg_score

Start   cMperMb     cMatstart   End     Chromosome  Id1     Overlap     AvgScore
0   2916415     1.223681    3.272236    2917484     chr1    0   1   12.236813
1   2916415     1.223681    3.272236    2917484     chr1    1   24  12.236813
2   2916415     1.223681    3.272236    2917484     chr1    2   5   12.236813
3   2916415     1.223681    3.272236    2917484     chr1    3   74  12.236813
4   2916415     1.223681    3.272236    2917484     chr1    4   110     12.236813
...     ...     ...     ...     ...     ...     ...     ...     ...
947     2960324     0.269208    3.291457    2960462     chr1    913     138     0.001951
948     2960462     0.352644    3.291494    2960790     chr1    913     77  0.018319
949     2960462     0.352644    3.291494    2960790     chr1    914     6   0.018319
950     2960462     0.352644    3.291494    2960790     chr1    915     15  0.018319
951     2960462     0.352644    3.291494    2960790     chr1    916     71  0.018319

952 rows × 8 columns
## input data contains 917 sections --> mismatch!

res_dic = {}
for x,y in zip(j_with_avg_score.Start, j_with_avg_score.AvgScore):
    res_dic[x] = y
res_dic

{2916415: 12.236813262999997,
 2917484: 0.02265139573888889,
 2917538: 0.06125764894,
 2917608: 0.10651243958260867,
 2918281: 0.6792060563708334,
 2918836: 1.1527867390640016,
 2921187: 4.176119918333334,
 2921274: 1.2543028034,
 2921300: 0.9058800047555555,
 2921976: 3.26162101122,
 2922306: 0.4522015679581395,
 2923593: 0.7409518310923077,
 2924172: 8.386433179800006,
 2925614: 0.31748233525000014,
 2926340: 0.17712928483599996,
 2926675: 1.4567026153333333,
 2926730: 5.063891720272731,
 2927172: 2.42991683355,
 2927410: 0.9370814839,
 2927411: 0.1303501307571428,
 2928125: 0.20534225654799998,
 2928557: 0.19228154158888885,
 2928849: 1.5796778519999994,
 2929269: 1.9946231915199983,
 2931597: 0.15826380113170732,
 2933043: 0.010025524,
 2934387: 0.05559167711694925,
 2938888: 0.0023231045055555556,
 2940194: 0.01882597932,
 2941104: 0.1670264778,
 2941694: 0.0197562495886076,
 2942700: 0.3931709166833331,
 2946526: 1.6788888500999994,
 2947460: 0.19597836537931007,
 2951262: 5.532616244500001,
 2956899: 0.44889279189999975,
 2960324: 0.0019507828376811595,
 2960462: 0.018319161953246753}
Something's getting chewed up here, due to the number of unique sections in the output, the duplicates, and the start and end positions not matching the input data.
However, the first value calculated is exactly the same as what I had gotten in my R script (with a few magnitude adjustments): 2916415: 12.236813262999997 vs 2917178: 0.00012236813263
So the calculations happening are most likely correct, I think it's mainly the start and end positions that are getting messed up.
