I have 25 tumor samples with counts data. Initially, I filtered out low expressed genes and then converted counts to varianceStabilizingTransformation using deseq2 package. With this data I started using WGCNA for co-expression network analysis.
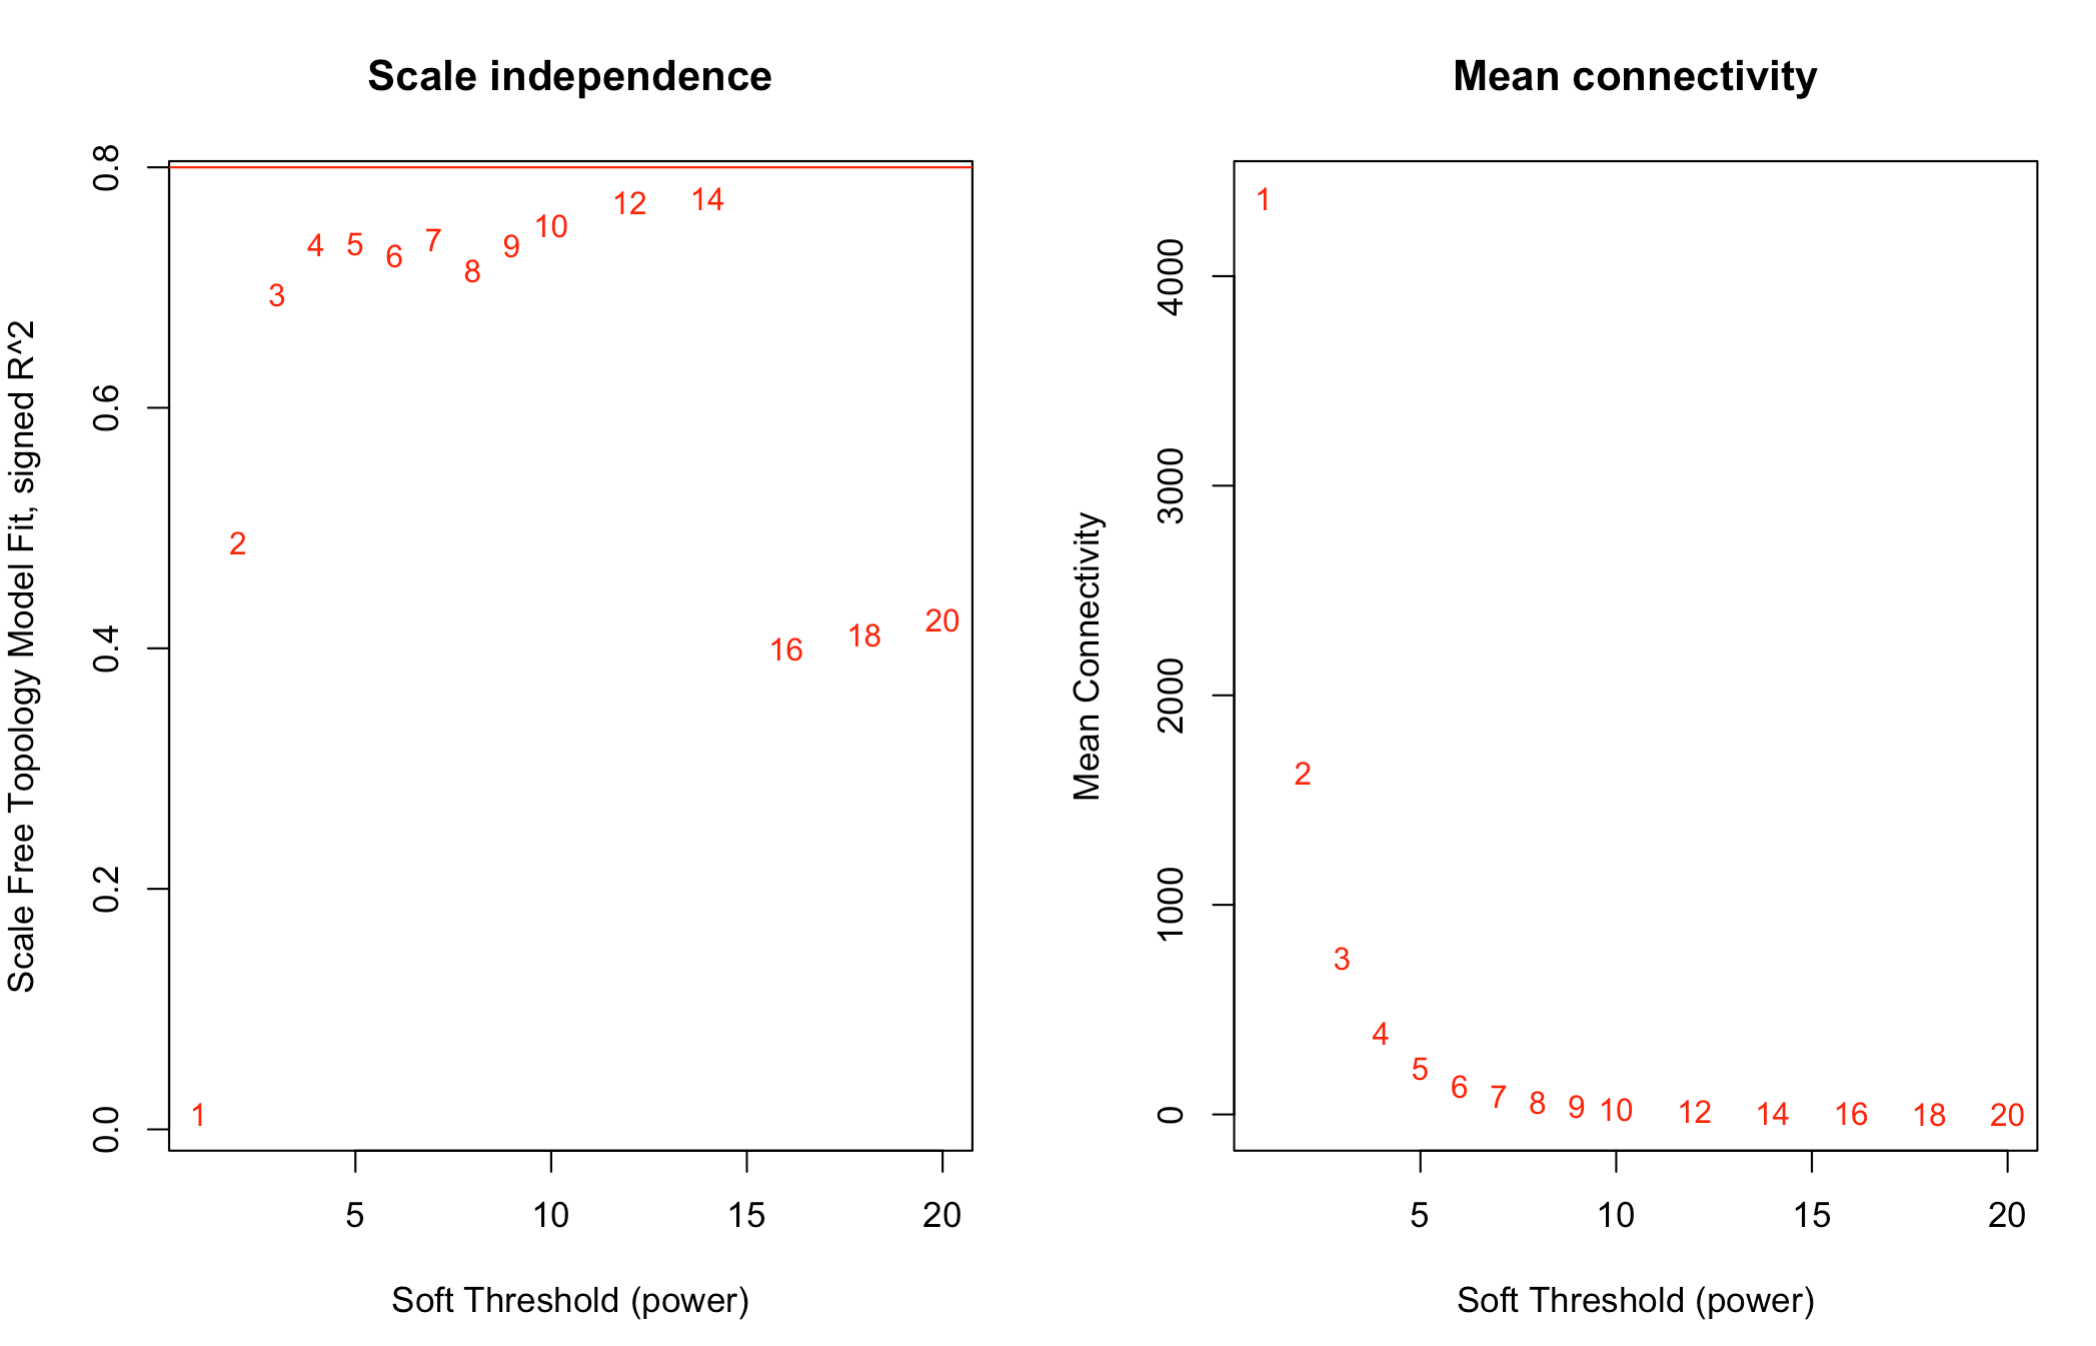
For selecting the soft threshold I see very strange plot. R2 cutoff is 0.8 and I see that none of the scale free topology model fit is above that.
Here is the code I used:
df is a dataframe with genes as rows and 25 samples as columns with counts data.
library("DESeq2")
filtered.counts <- df[rowSums(df==0)<5, ]

U3 <- as.matrix(filtered.counts)
vsd <- vst(U3, blind=FALSE)

oed <- vsd

gene.names=rownames(oed)
trans.oed=t(oed)
dim(trans.oed)

n=16462;
datExpr=trans.oed[,1:n]
dim(datExpr)

SubGeneNames=gene.names[1:n]

library(WGCNA)
options(stringsAsFactors = FALSE);
allowWGCNAThreads()

powers = c(c(1:10), seq(from = 12, to=20, by=2));
sft=pickSoftThreshold(datExpr,dataIsExpr = TRUE,
                      powerVector = powers,corFnc = cor,
                      corOptions = list(use = 'p'),networkType = "unsigned")

   Power SFT.R.sq  slope truncated.R.sq mean.k. median.k. max.k.
1      1 0.000273  0.041          0.786 4140.00  4000.000 6730.0
2      2 0.428000 -1.130          0.852 1570.00  1400.000 3770.0
3      3 0.673000 -1.540          0.882  729.00   579.000 2410.0
4      4 0.737000 -1.720          0.891  383.00   268.000 1670.0
5      5 0.745000 -1.830          0.886  220.00   134.000 1210.0
6      6 0.704000 -1.990          0.860  134.00    71.700  909.0
7      7 0.737000 -1.980          0.890   85.90    40.300  701.0
8      8 0.742000 -2.020          0.903   57.30    23.500  551.0
9      9 0.733000 -2.090          0.917   39.40    14.200  441.0
10    10 0.750000 -2.080          0.934   27.80     8.810  357.0
11    12 0.770000 -2.080          0.952   14.80     3.670  243.0
12    14 0.775000 -2.090          0.951    8.43     1.660  171.0
13    16 0.397000 -2.820          0.459    5.06     0.801  124.0
14    18 0.409000 -2.770          0.474    3.18     0.406   91.4
15    20 0.421000 -2.720          0.490    2.06     0.215   68.8


# Plot the results
sizeGrWindow(9, 5)
par(mfrow = c(1,2));
cex1 = 0.9;

# Scale-free topology fit index as a function of the soft-thresholding power
plot(sft$fitIndices[,1], -sign(sft$fitIndices[,3])*sft$fitIndices[,2],xlab="Soft Threshold (power)",ylab="Scale Free Topology Model Fit, signed R^2",type="n", main = paste("Scale independence"));
text(sft$fitIndices[,1], -sign(sft$fitIndices[,3])*sft$fitIndices[,2],labels=powers,cex=cex1,col="red");
Is this the right way? Which soft threshold power should I select?
Any help is appreciated. thanq.
