3
$\begingroup$

I am performing a quantitative trait association between the expression of one gene and ~400,000 methylation values. First, both variables are rank inverse normal transformed, adjusted for confounders (technical and for family structure) in a mixed-effects model and we use the residuals for the association. Then we do a linear regression between the residuals of expression and each methylation site, adding other four confounders in the model (age, BMI, etc.). The sample size is of ~500. For the association we are using MatrixEQTL.

When we check the p-values, they are clearly inflated. Is it something that I have to be concerned about? Did I probably miss something in the analysis? Thanks in advance.
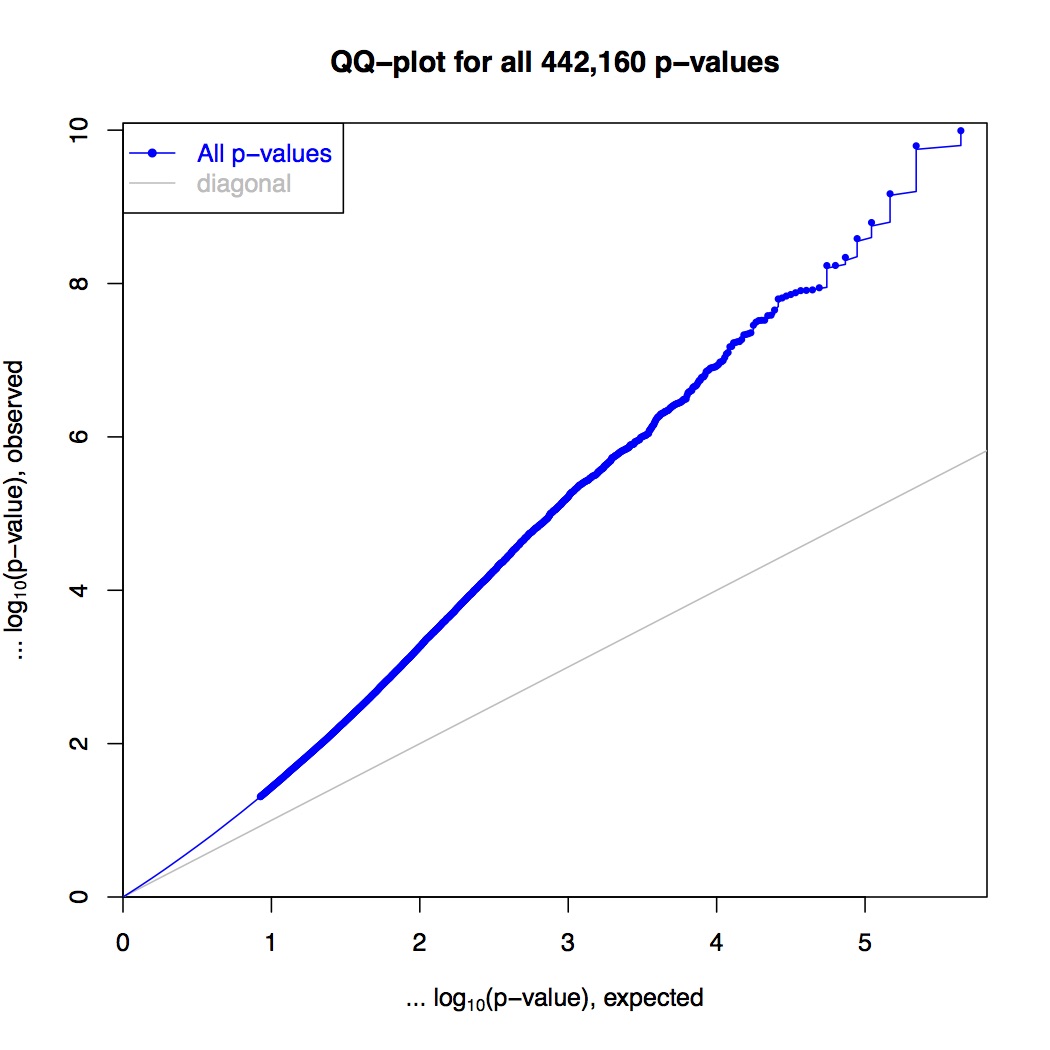
QQ-plot of association analysis

$\endgroup$
6
  • 1
    $\begingroup$ it's a long chunk of data processing... so normally it looks like this when you are using the wrong distribution... what is the test used by MatrixEQTL ? One way to check whether that is performing ok is to permute your residuals and run MatrixEQTL again.. If it doesn't follow the diagonal, it means your data is not suitable for this.. amazing package $\endgroup$
    – StupidWolf
    Commented May 19, 2020 at 10:20
  • $\begingroup$ It performs a linear regression (least squares model) and a t-test for the significance of the coefficients. $\endgroup$
    – sergiovm
    Commented May 19, 2020 at 10:35
  • 3
    $\begingroup$ try permuting your phenotype and see whether this qqplot still holds? $\endgroup$
    – StupidWolf
    Commented May 19, 2020 at 11:46
  • $\begingroup$ Thanks @StupidWolf $\endgroup$
    – sergiovm
    Commented May 20, 2020 at 12:38
  • $\begingroup$ @MaximilianPress explained it better than me lol... so if you permute does this inflation go away? Honestly, I have always done it from scratch.. this chunk you mentioned above, i supposed involves some god zillion packages? Hard to tell where it goes wrong $\endgroup$
    – StupidWolf
    Commented May 21, 2020 at 1:07

1 Answer 1

4
$\begingroup$

Permutation as suggested by @StupidWolf's comment is essential to understand what's going on. If permutation makes this pattern go away, then you have a problem with your model specification, there's something uncorrected.

If your data are weird, well, that's just how they are. But this argues to me that something else is going on confounding your associations. Cryptic population structure in the data would lead to this kind of pattern, e.g. here. That is the first thing that most reviewers would say, I'd guess.

Some random thoughts:

  1. What does the distribution of your methylation data look like after normalization?

  2. Your observed distribution is basically never on the expected line, which argues strongly for confounding.

  3. How are you adjusting for non-independence of methylation types? Family-wise correction is likely not specific enough. You may have to estimate an identity-by-state SNP similarity matrix for your population and fit that as part of your model, or at least fit 10-20 principal components to account for population structure.

  4. How are you representing your methylation status? If it's binary you might look at this paper.

$\endgroup$
2
  • $\begingroup$ Thanks @MaximilianPress. Actually I'm don't think we have other confounding variables, we are correcting for all the possible ones, including family structure, and all data come from the same population. After the adjustment for residuals of methylation, data is normally distributed. It is not binary, but the probability of being methylated. I'll check the papers you mention. $\endgroup$
    – sergiovm
    Commented May 20, 2020 at 12:43
  • $\begingroup$ @SergioVillicana You honestly can never know whether you have corrected for all confounding variables. Family structure is ok but underlying genetic relatedness, e.g. cryptic relatedness, is much more difficult to detect. Additionally, I realized that the Arabidopsis paper (mentioning the epigenetic similarity matrix) might not be appropriate, I got confused thinking about methylation as response vs. explanatory. I'm editing the answer to remove that paper. $\endgroup$ Commented May 20, 2020 at 16:24

Your Answer

By clicking “Post Your Answer”, you agree to our terms of service and acknowledge you have read our privacy policy.

Not the answer you're looking for? Browse other questions tagged or ask your own question.