0
$\begingroup$

I have a set of different phenotypes which I want to use for a GWAS analysis (general linear model). I have a couple of questions and uncertainty about the phenotype data input.

  1. I have control and samples and usually we normalize all sample to the control for other calculations.

Example:

Mean control - 60%

Mean sample1 - 20 %

Mean sample1 normalized to control - 20*100/60 = 33,3 %

Is this normalization step correct for a GWAS analysis?

  1. Should the phenotype data scaled into 0...1 range? I have different scales for different phenotypes but the results should be compared and compatible.

  2. Some of my phenotypes are not normality distributed. What is the best way to handle such data? I have read that the data should be normally distributed for GWAS analysis.

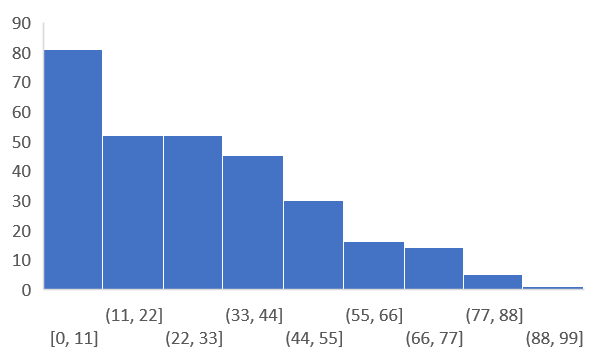
Here are the histograms of two phenotypes:
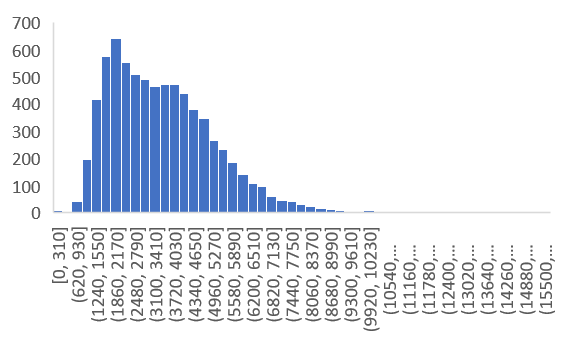
phenotype 1

phenotype 2

$\endgroup$
4
  • $\begingroup$ Please could you clarify if by "GWAS analysis" you are referring to general linear modelling (GLM)? This is regression analysis assessed using regression weights and a residual to understand the association between alleles and phenotypes. Is that correct? $\endgroup$
    – M__
    Commented Oct 8, 2020 at 10:02
  • $\begingroup$ Normalisation is standard procedure for GLM $\endgroup$
    – M__
    Commented Oct 8, 2020 at 10:06
  • $\begingroup$ Yes it's general linear modelling (written in the first sentence). $\endgroup$
    – snowflake
    Commented Oct 8, 2020 at 10:47
  • 1
    $\begingroup$ Okay you need to do this via a Q-Q plot, or at least it is one way to do this. The an alternative is to minimise the residual. When I get a chance I'll post an explanation. You don't necessarily need to transform, it depends on the 'diagnostics', e.g. Q-Q. $\endgroup$
    – M__
    Commented Oct 8, 2020 at 10:59

0

Your Answer

By clicking “Post Your Answer”, you agree to our terms of service and acknowledge you have read our privacy policy.

Browse other questions tagged or ask your own question.