7
$\begingroup$

I was asked to check the synteny of some genes in two genome assemblies of the same species (PacBio & Illumina). I was given two scaffolds couples (so 4 scaffolds total) in the Illumina genome and asked if they were assembled together in the PacBio assembly.

So, I proceeded with a DNA-DNA alignment with minimap2 of the two Illumina scaffolds on the PacBio whole genome. But I am not sure on how to directly use the sam file for the question I was asked. So I tried to visualize this alignment using Mauve. It worked for the first couple, but it failed (blank page) for the second couple of scaffolds.

Surely, Mauve is not the best option out, so can you suggest an alternative? This is a chordata genome.

$\endgroup$

3 Answers 3

4
$\begingroup$

After a bit of digging, finally found exactly what I was looking for. I'll share here in case someone else was looking for the same thing.

I used a standard Nucleotide BLAST (blastn), coupled with MUMmer. Short tutorial.

Assuming that xn & yn are the couple of scaffolds I want to check if they are assembled together in the Pacbio assembly (a multi-fasta file):

1) first, I blasted the pair of Illumina scaffolds (as separate queries) to the PacBio genome (as subject):

blastn -query ../illumina_asm/scaffold_x1.fa -subject ../pacbio_asm/genome.fa > out_scaffold_x1; blastn -query ../illumina_asm/scaffold_y1.fa -subject ../pacbio_asm/genome.fa > out_scaffold_y1

The candidates PacBio scaffolds shall appear in the top blastn hits in both out_scaffold_x1 & out_scaffold_y1.

Let's assume we found one common scaffold only - corresponding to the fasta entry pacbio_scaffold in the PacBio genome.

2) extract the sequence of the target scaffold from the PacBio assembly, using samtools faidx:

samtools faidx ../pacbio_asm/genome.fa; samtools faidx ../pacbio_asm/genome.fa 'pacbio_scaffold' > pacbio_scaffold.fa

3) concatenate the Illumina scaffolds to analyze:

cat ../illumina_asm/scaffold_x1.fa ../illumina_asm/scaffold_y1.fa > illumina_scaffolds.fa

4) compare the Illumina scaffolds to the PacBio assembly using nucmer from MUMmer:

nucmer --prefix=pacbio_scaffold pacbio_scaffold.fa illumina_scaffolds.fa

this will generate a pacbio_scaffold.delta file, used in the next step

5) filter the delta file to keep only the most meaningful alignments file using delta-filter from MUMmer (avoiding confusing messy plots later):

delta-filter -m pacbio_scaffold.delta > pacbio_scaffold.delta.m

6) use mummerplot from MUMmer to achieve a graph:

mummerplot --png pacbio_scaffold.delta.m -R pacbio_scaffold.fa -Q illumina_scaffolds.fa --prefix=pacbio_scaffold -large -layout

On the x-axis, the PacBio scaffold they have in common. On the y-axis, the two Illumina scaffolds (separated by the horizontal grey abline). Colors correspond to the orientation.

Example of Illumina scaffolds linked in the PacBio assembly:
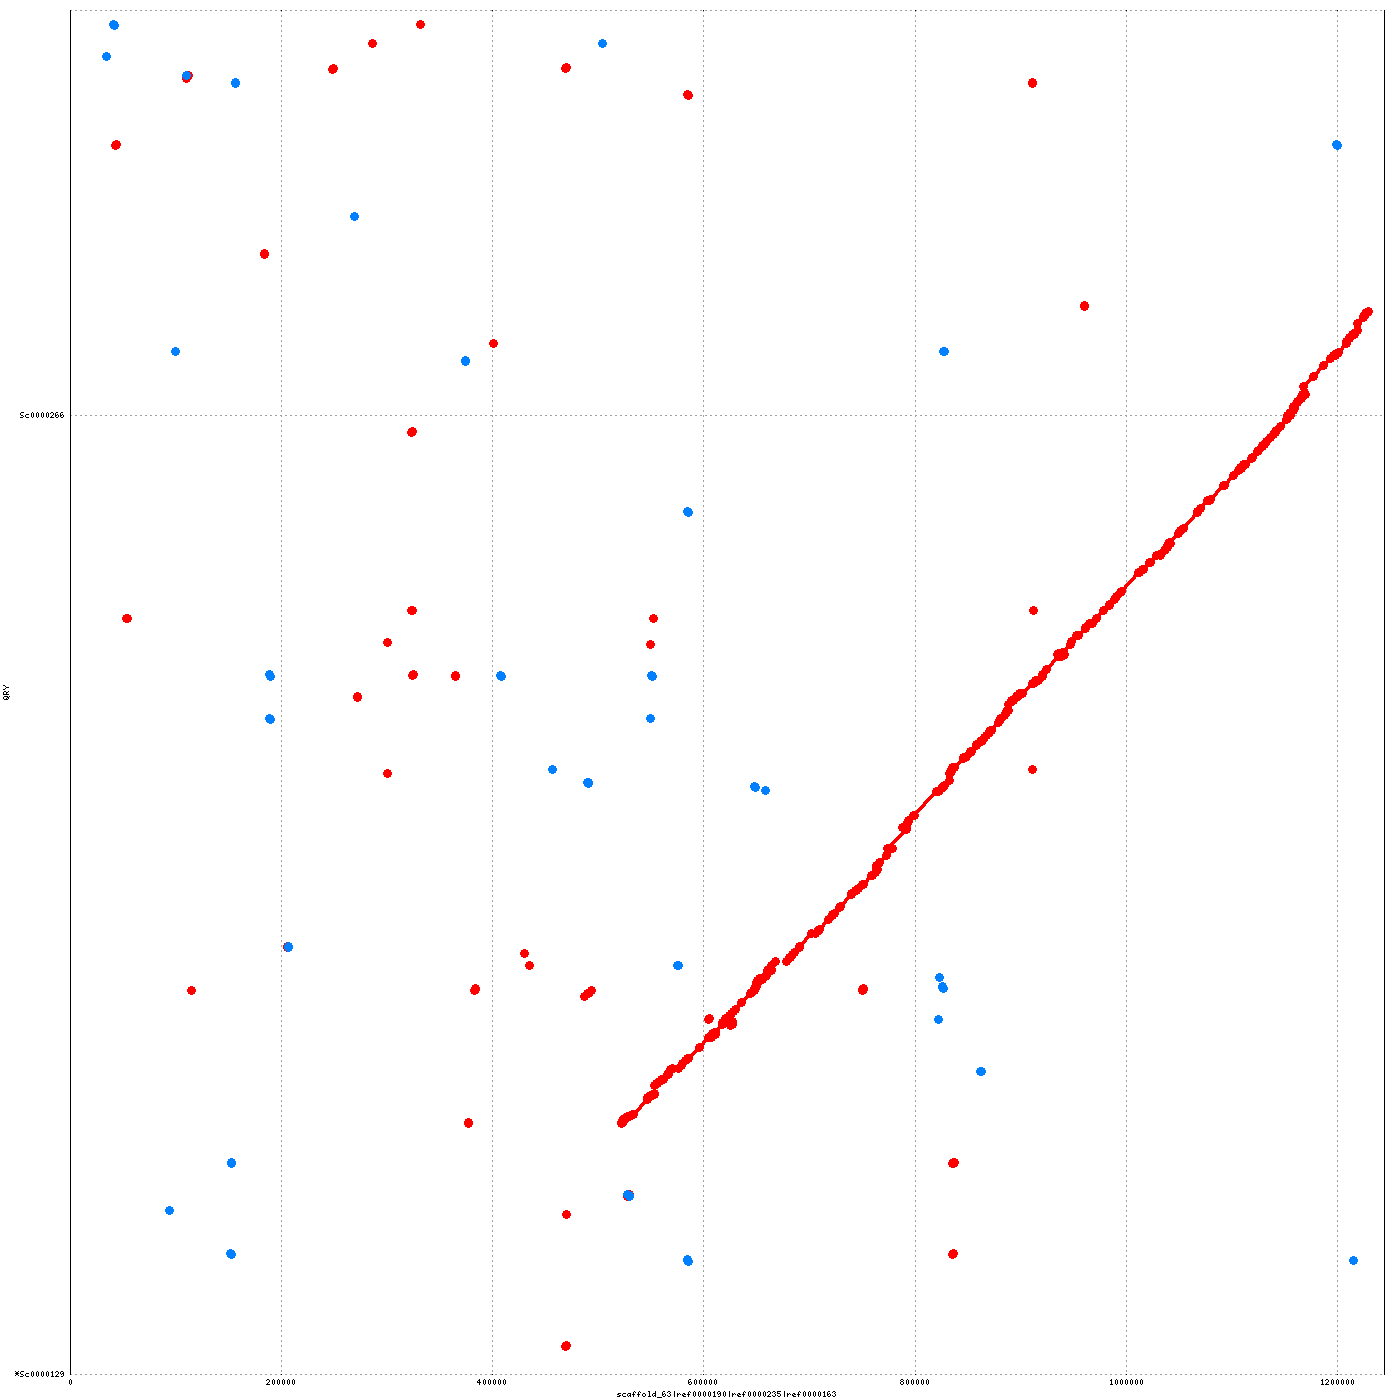
Example of Illumina scaffolds linked in the PacBio assembly

$\endgroup$
2
  • 1
    $\begingroup$ If you prefer dotter plot: peerj.com/preprints/26567. There is also minimap2 -DP ref.fa query.fa|miniasm/minidot - > dot.eps, though the visual is not as good as mummerplot. $\endgroup$
    – user172818
    Commented Apr 26, 2018 at 16:36
  • $\begingroup$ Also: (1) MashMap - repo has a dotplot script: github.com/marbl/MashMap & (2) Assemblytics - requiring a nucmer delta file: assemblytics.com $\endgroup$
    – aechchiki
    Commented Apr 27, 2018 at 10:20
3
$\begingroup$

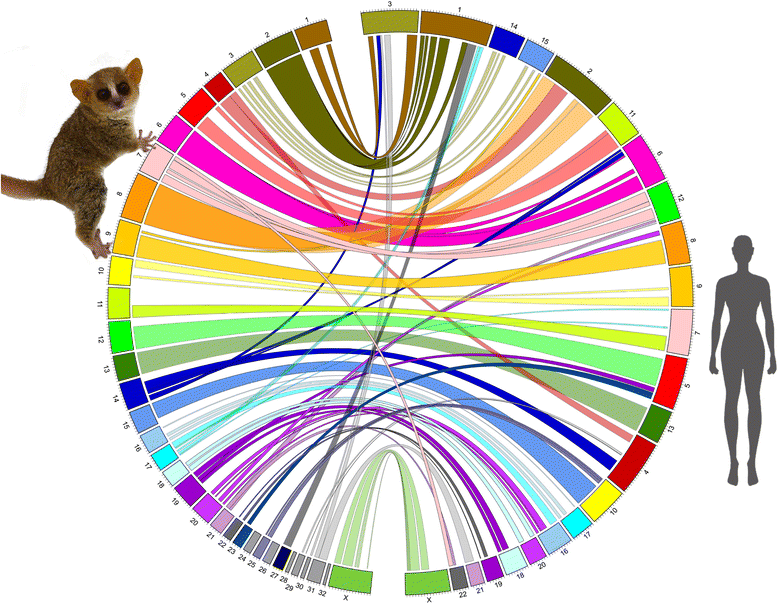
I think you could use circos for this. The configuration is kind of tedious but it gives nice results. You would basically need to retrieve alignments coordinates and parse them into this format.

scaf1 19720 31917 scaf2 28307 34227
scaf1 28307 34227 scaf2 19720 31917

Example figure: enter image description here

$\endgroup$
1
  • $\begingroup$ nice thanks! I has also been advised to try MUMmer (mummer.sourceforge.net), for easy dotplots $\endgroup$
    – aechchiki
    Commented Apr 25, 2018 at 21:56
2
$\begingroup$

I remember a few options for pairwise genome visualisation (which may be outdated BTW):

$\endgroup$
1
  • 1
    $\begingroup$ Thanks Léo! Maybe also worth of notice: (1) Geopard for GUI-dotplot: cube.univie.ac.at/gepard; (2) Ribbon - and actually (3) Mauve could also be run from command-line: sourceforge.net/p/ngopt/wiki/… Enough material for next bioinfo-DEE meeting I guess ;) $\endgroup$
    – aechchiki
    Commented Apr 27, 2018 at 6:58

Your Answer

By clicking “Post Your Answer”, you agree to our terms of service and acknowledge you have read our privacy policy.

Not the answer you're looking for? Browse other questions tagged or ask your own question.