I'm working with a Daphnia data set looking at the 16s gene pulled from the BOLD database. So far I did
- a multiple sequence alignment and
attempted to cluster and plot a dendrogram:
myClustalWAlignment <- DNAStringSet(msa(MySeqString, cluster="nj", gapOpening=30.0, gapExtension=20.0, maxiters=2, substitutionMatrix="default", type="default", verbose=TRUE))
Replace full sequence names with Accession numbers for easy identification
names(myClustalWAlignment) <- Daphnia_DF$Accession_number
Converts the alignment object into a DNAbin class. Some of the results are shown and may be useful for further analysis:
ClustalAlignment_dnaBin <- as.DNAbin(myClustalWAlignment)
Creating a distance matrix:
distmat <- dist.dna(ClustalAlignment_dnaBin, model = "TN93", as.matrix = TRUE, pairwise.deletion = TRUE)
clustering the sequences:
Daphnia_Clustered <- IdClusters(distmat, method = "UPGMA", cutoff = 0.01, showPlot = TRUE, type = "both", myXStringSet = NULL, model = MODELS, collapse = 0, processors = NULL, verbose = TRUE)
checking to see the number of clusters:
length(unique(unlist(Daphnia_Clustered1)))
output: 80
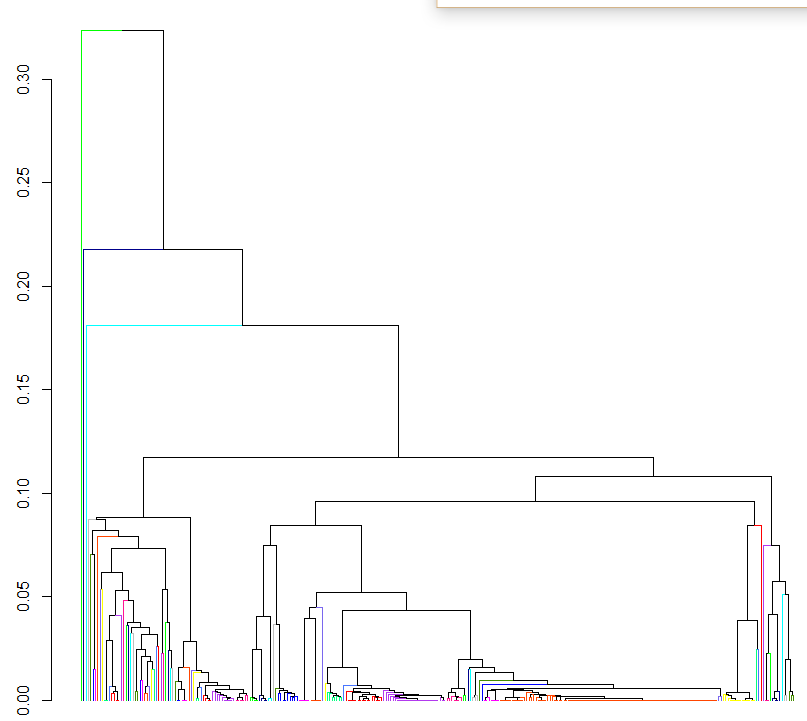
The problem is that I want a dendrogram showing just the 80 clusters if that's possible. Right now the output of the above clustering is:
Is there a way to get a smaller number of clusters? Or even being able to plot just the 80 OTU clusters would be great. Is there an easy way of reconstructing the phylogenetic relationship between these clusters?
