I would like to make a chord plot from my data. I have a list of genes that according to my experiments are divided into 64 clusters of enrichment pattern.
I would combine my 64 clusters with a second clustering. A clustering of all the human genes into subgroups of "interacting" genes (e.g. both are pathway, co-expressed) will allow me to combine the two clustering data on a chord plot.
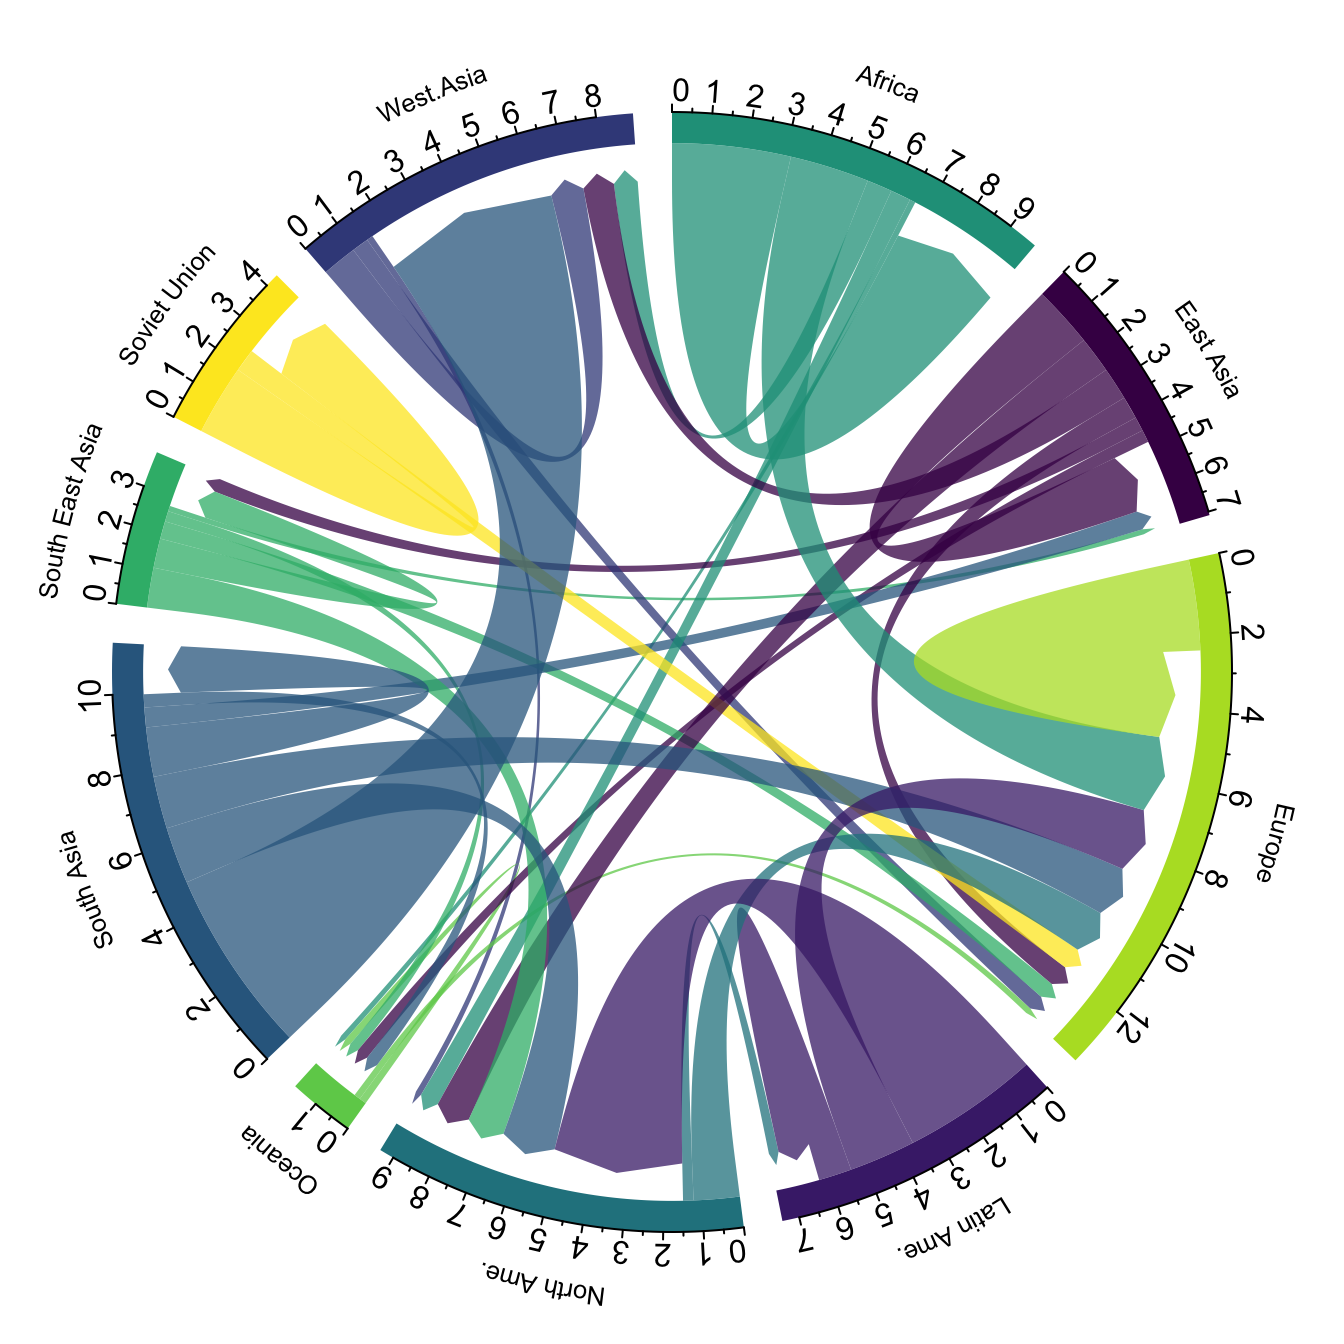
In the analogy of the following graph the continents will be my 64 clusters of the genes and the edges/chords will be assigned based on the biological function clustering. I guess that such a functional clustering can be done ore has been done using platforms such as: KEGG, genescf, or reactome.org.
- Is there a biological pathway clustering of genes for lymphoblastoid or breast cell lines?
- Are there any suggestions how to build the clustering between genes whose functions are strongly correlated in the cell?
Edit: the question is about getting the clustering from a system-biological perspective not how to plot chord diagrams.
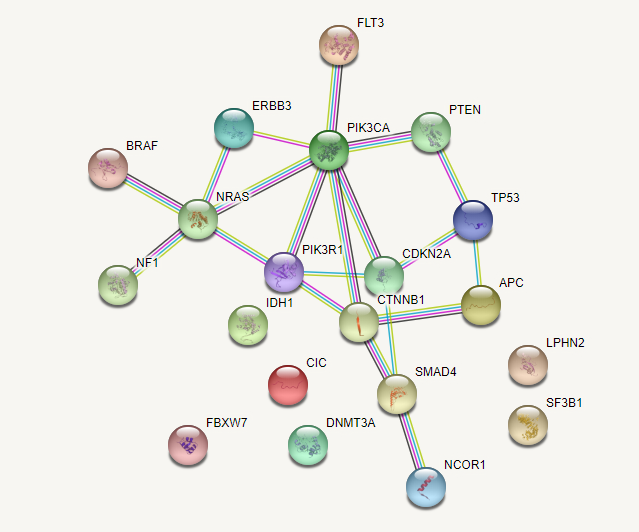
Is there such a metric to quantify how likely two genes are correlated in their enrichment, function etc. For example, using STRING we can see that PIK3CA and PTEN are more co-functioning than PIK3CA and SF3B1. How can I do something like String on genome wide scale.

