0
$\begingroup$

I would like to make a chord plot from my data. I have a list of genes that according to my experiments are divided into 64 clusters of enrichment pattern.

I would combine my 64 clusters with a second clustering. A clustering of all the human genes into subgroups of "interacting" genes (e.g. both are pathway, co-expressed) will allow me to combine the two clustering data on a chord plot.

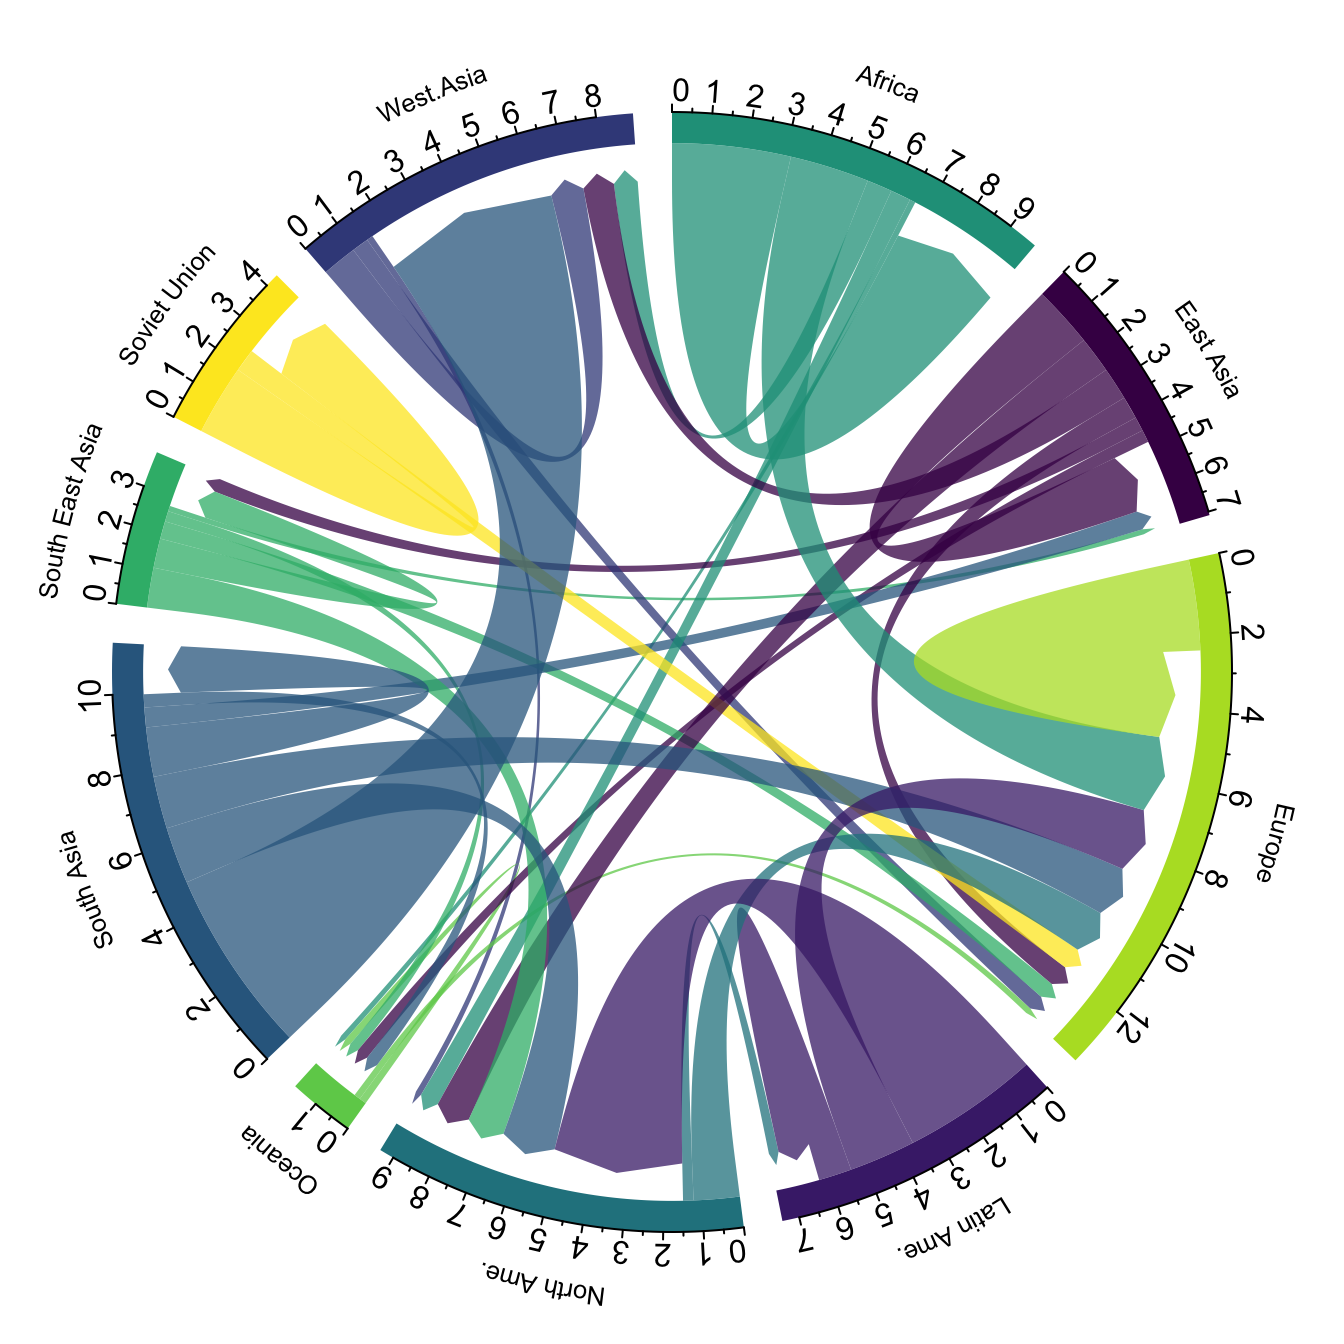
In the analogy of the following graph the continents will be my 64 clusters of the genes and the edges/chords will be assigned based on the biological function clustering. I guess that such a functional clustering can be done ore has been done using platforms such as: KEGG, genescf, or reactome.org.

enter image description here

  1. Is there a biological pathway clustering of genes for lymphoblastoid or breast cell lines?
  2. Are there any suggestions how to build the clustering between genes whose functions are strongly correlated in the cell?

Edit: the question is about getting the clustering from a system-biological perspective not how to plot chord diagrams.

Is there such a metric to quantify how likely two genes are correlated in their enrichment, function etc. For example, using STRING we can see that PIK3CA and PTEN are more co-functioning than PIK3CA and SF3B1. How can I do something like String on genome wide scale.
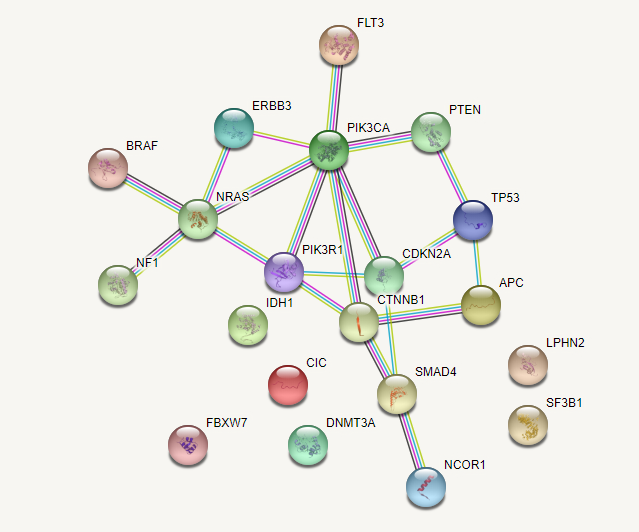
enter image description here

$\endgroup$
2
  • $\begingroup$ Its difficult to understand the experiment, so not easy to recommend something other than generic correlation/covariance $\endgroup$
    – M__
    Commented Feb 17, 2019 at 22:20
  • $\begingroup$ @MichaelG. Would like something that measure the distance between two genes on the multigraph of pathways. $\endgroup$
    – 0x90
    Commented Feb 17, 2019 at 22:23

2 Answers 2

2
$\begingroup$

To measure if two genes are functional similar I developed the BioCor package. It calculates a similarity score between genes by the measuring the amount of pathways shared. However, it doesn't take into account the strength of the connection between two proteins. You could multiply the similarity by a value between 0 and 1 according to the number of evidences of the relation between the two proteins.

It is optimized for large amounts of data, you could even perform them in parallel, but I doubt you find information about pathways for most of the genes (In my informal test, I think that I could calculate similarities for about 1600 genes not the ~20000 of the human genome).

When I am interested in co-expression data I calculate the co-expression by correlation and add the similarity of the genes calculated with BioCor. The resulting distance matrix can be used for clustering. Maybe the section about using weighted co-expression network analysis and BioCor can be helpful.

To have a "biological pathway clustering of genes for lymphoblastoid or breast cell lines", you would need to have a specific signature/pathway of the cell lines. Currently I am not aware of accepted standard signature database. The single cell atlas could be useful to find expression of your cells, but I don't know if they provide a signature for cell line

$\endgroup$
2
  • $\begingroup$ Is there a python version for it? $\endgroup$
    – 0x90
    Commented Feb 19, 2019 at 2:32
  • $\begingroup$ No, but you can use it in python by using rpy2 $\endgroup$
    – llrs
    Commented Feb 19, 2019 at 8:17
1
$\begingroup$

Production of a chord diagram is described in detail here. You use the R package with either,

library(chorddiag)
library (circulize)

The first level clusters are predefined and the second layer of clustering is what you need to work out. The obvious stat is correlation, secondly (better approach IMO) you might look at covariance, although I don't exactly know what this "interaction" constitutes, which makes it difficult.

My personal view is the diagramatic representation doesn't really matter, its the robustness of the stats behind the diagram that counts.

I was a bit surprised to learn ggplot2 doesn't do circular diagrams :-(

Lymphoblastoid Cell lines

I think you need to clarify the experiment on these cells lines, I assume its a time course, i.e. time series.


At a guess this is RNA expression, if you are using a chip then its between predetermined genes (i.e. spotted on the chip). If it is RNA seq then it can be anything. I suspect you are treating the cells and monitoring changes in RNA expression as a function of their biological (immunological?) activity. If the basic measure is time, i.e. a time series - thus two genes being expressed in the same unit time the best opening statistic is covariance. If all you want to do is make a chord diagram out of it, I think thats fine, this will form a 2x2 variance matrix for which any standard clustering will work (Jaccard distances [there will be better ones]) or direct plotting from the matrix. If you looking at unique expression behaviour to attempt to unlock some sort of pathway then you are into more serious regression time series (autoregression that sort of thing - this is complicated). If its oscillations then its a separate branch of stats based on sinosoids (sine waves) called periodicity analysis. HOWEVER, if the interaction is genetic similarity (gene families) e.g. mRNA then you want a phylogenetics measure, which if its clustering neighbor-joining is fine.


My personal view if it is the experiment I think, I would,

  1. Construct a matrix of the covariance of the (I assume) time series
  2. Make sure the covariance is standarised between -1 to 1 (Pearson approach), R-cran.
  3. Assign a tight cut-off (tricky because there's no "hard cut-off") but say 0.7 (you need to experiment a bit)
  4. Plot the raw covariance on the chord diagram.

Easy, simple and highly visual.

$\endgroup$
1
  • $\begingroup$ For my experiment, I know how to cluster it. My question is independent! I would to find a metric that assign a distance to two genes according to their functions. If they happen to function together in the same context/pathways they will be close. For example, the proteins of NRAS and PIK3CA will be closer than NRAS and SF3B1 (version10.5.string-db.org/cgi/network.pl?taskId=KbO2wnULZxKQ) I am looking for a resource to be able to build such thing on a genome wide scale. $\endgroup$
    – 0x90
    Commented Feb 18, 2019 at 0:33

Your Answer

By clicking “Post Your Answer”, you agree to our terms of service and acknowledge you have read our privacy policy.

Not the answer you're looking for? Browse other questions tagged or ask your own question.