I have a collection of phylogenetic trees produced from clustering DNA sequences, mostly a few nodes in each cluster/tree, with several clusters of size 1. And I would like to visualize them all together to get an idea of the relative sizes of the trees in the collection of clusters (cluster set).
E.g.
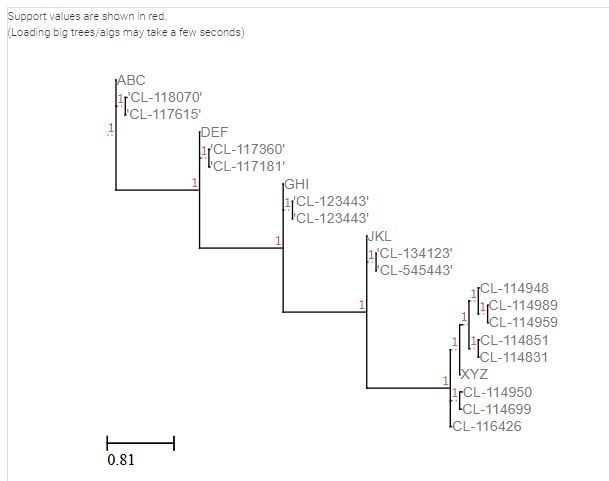
(ABC:0.0,('CL-118070':0.02010925,'CL-117615':0.00526463):0.00443474);
(DEF:0.0,('CL-117360':0.00967856,'CL-117181':0.00967856):0.00990975);
(GHI:0.0,('CL-123443':0.00123443,'CL-123443':0.00132446):0.00123435);
(JKL:0.0,('CL-134123':0.00123441,'CL-545443':0.00343446):0.00134335);
((((CL-114948:0.00908659,(CL-114989:0.00324875,CL-114959:0.00536289):0.00037038):0.00457230,(CL-114851:0.01291841,CL-114831:0.00590321):0.00077034):0.03411459,XYZ:0.00251364):0.00207594,(CL-114950:0.03074481,CL-114699:0.02256162):0.00733986,CL-116426:0.01643848);
I am thinking there must be a tool where I give it an input file with a tree per line and shows them as all in one go.
Any suggestions:
EDIT: looking at the options below:
https://en.wikipedia.org/wiki/List_of_phylogenetic_tree_visualization_software
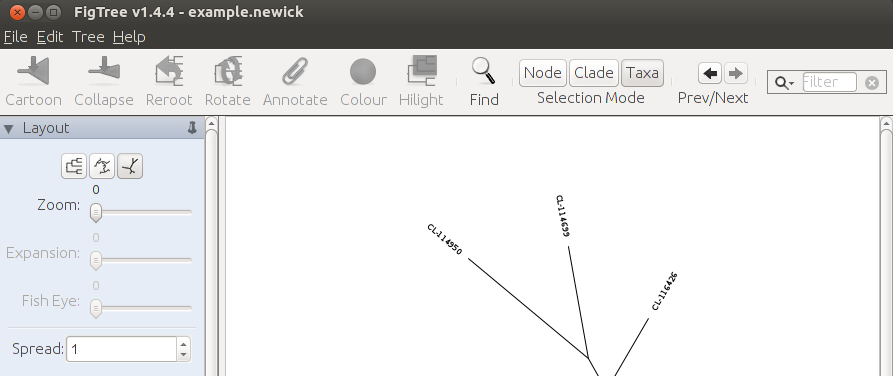
FigTree: in this tool, one can load several trees, one per line, and there is a 'Prev/Next' menu to iterate over them, but no apparent option to display all of them at once.
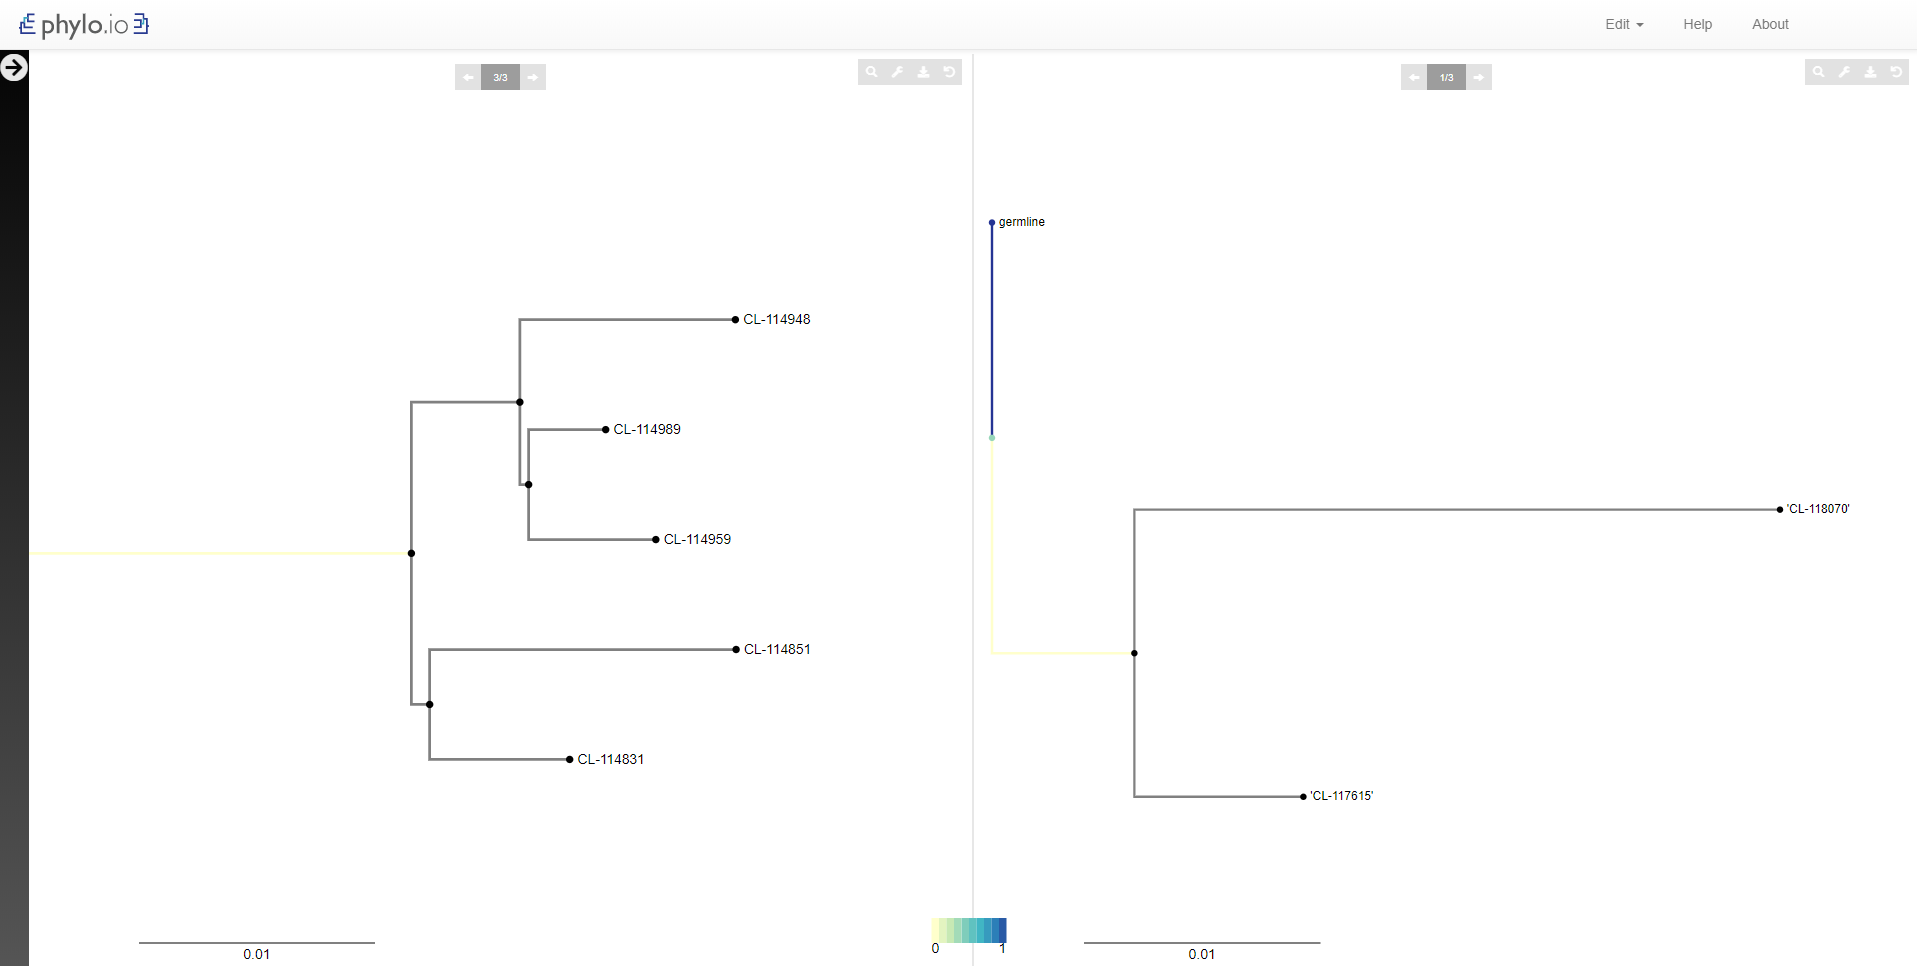
Phylo.io: in this tool, one can load several trees, and display one at a time or two of them, with colouring options that compare the common nodes/branches. There isn't an apparent option to visualize many trees in one go.
PhyBin: this tool (https://cs.indiana.edu/~rrnewton/projects/phybin/) seems to cluster the sets of trees, but not visualize all of them together.
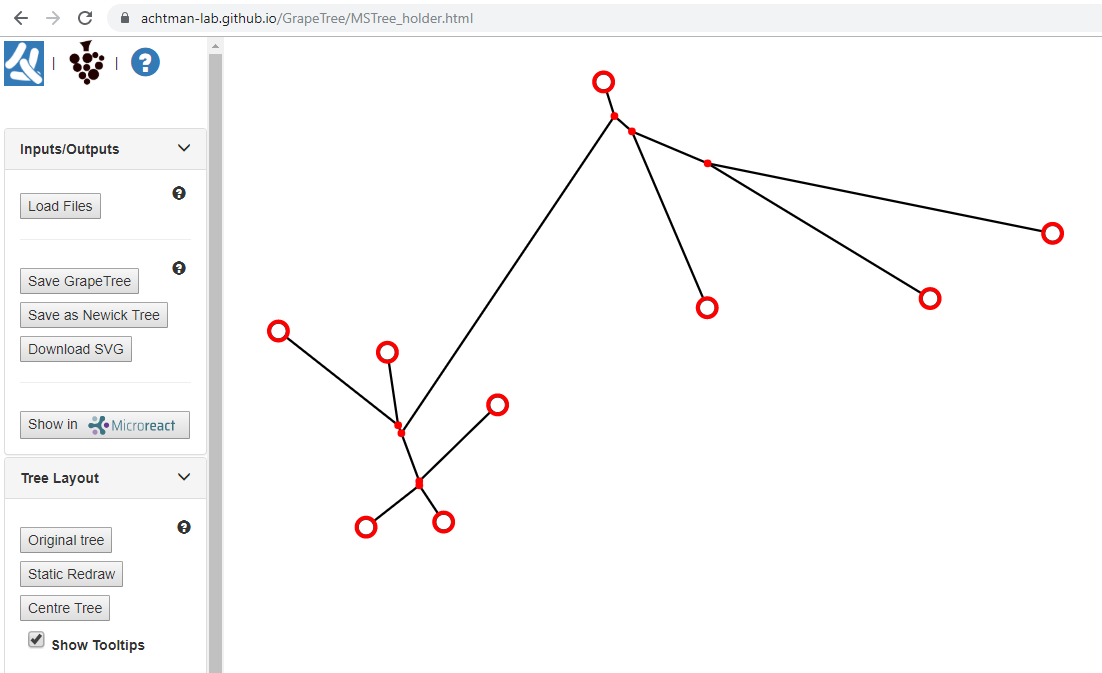
GrapeTree: this tool () can visualize only one tree at a time. It displays the last tree in the list if more than one are copy+pasted in the input text box.
There is another group of tools under Graph drawing: https://en.wikipedia.org/wiki/Graph_drawing
Cytoscape: this tool is designed for network visualizations, which could be an option. Unsure if it visualizes newick trees, but there is are tools to convert trees to networks that could potentially work in combination with Cytoscape, e.g. https://github.com/MonsantoCo/Newick2Network
ete3you can count the number of leaves, number of nodes etc. in each tree. These kind of stats might be more informative than a visualisation depending on your interest $\endgroup$